黄金:抗通胀,还是抗波动?Gold: an inflation hedge, or a volatility hedge?
「黄金抗通胀」是最常听到的一句话。本文用 1968-01 至 2026-08 共 703 个月的伦敦金价与美国 CPI 检验它,结论分两层。在 58 年的尺度上这句话是对的——黄金名义价格上涨 122 倍,同期通胀只涨 9.8 倍,实际购买力翻了 12.5 倍;但没有人能用这个结论保护自己——1980 年 1 月买在高点的人,实际购买力最深跌掉 83%,直到 2025 年 2 月才回到原地,等了 45 年。所以黄金真正对冲的不是通胀,是组合的波动:它与标普 500 的月度相关性是 −0.08,往 60/40 里加 10%,年化收益几乎不变,最大回撤从 28.4% 降到 24.6%。 "Gold is an inflation hedge" is one of the most repeated claims in investing. We test it on 703 monthly observations of the London gold price and US CPI from January 1968 to August 2026. The answer has two layers. Over 58 years the claim is true — gold rose 122-fold while CPI rose 9.8-fold, lifting real purchasing power 12.5 times. But nobody can use that result to protect themselves: someone who bought the January 1980 peak saw real purchasing power fall 83% and had to wait until February 2025 — 45 years — to get back to even. What gold actually hedges is portfolio volatility: its monthly correlation with the S&P 500 is −0.08, and adding 10% to a 60/40 leaves the return roughly unchanged while cutting the maximum drawdown from 28.4% to 24.6%.
- 58 年的尺度上黄金确实跑赢通胀:实际购买力 12.5 倍。但年度相关性只有 0.40,近二十年降到 0.08。 Over 58 years gold did beat inflation — real purchasing power up 12.5-fold. But the year-by-year correlation is only 0.40, and just 0.08 since 2005.
- 1980-01 的高点要等到 2025-02 才回本,等了 45 年;期间实际购买力最低跌到 −83%。 The January 1980 peak was not recovered until February 2025 — a 45-year wait, with real purchasing power falling as much as 83%.
- 持有黄金 10 年,四成的窗口是亏的(扣掉通胀后);把期限拉到 30 年才降到 13.7%。 Hold gold for ten years and 40% of windows lose money after inflation; only at a 30-year horizon does that fall to 13.7%.
- 通胀最高的 13 个年份里,有 5 次黄金是跌的。2022 年通胀 40 年最高,黄金只涨 0.4%。 In the 13 highest-inflation years, gold fell five times. In 2022, with inflation at a 40-year high, gold rose just 0.4%.
关键词 黄金 · 通胀对冲 · 实际利率 · 避险资产 · 组合分散化 · 资产配置Keywords gold · inflation hedge · real interest rates · safe haven · diversification · asset allocation
01这句话是从哪来的Where the claim comes from
「黄金抗通胀」有两个来源。一是历史记忆:在金本位时代,货币的定义本身就是一定重量的黄金,价格水平长期稳定,黄金自然成了"钱"的锚。二是上世纪七十年代的实证:布雷顿森林体系解体后的十年里,美国通胀一度超过 13%,而金价从 35 美元涨到 850 美元——那是黄金作为通胀对冲最有力的一次现场演示。
但要检验这句话,必须先处理一个口径问题:1968 年之前金价是被官方固定的,谈论"黄金跑赢通胀"没有意义。1968 年 3 月伦敦金池(London Gold Pool)瓦解,金价才真正开始由市场定价;1971 年尼克松关闭黄金窗口,法币与黄金彻底脱钩。因此本文的样本从 1968 年 1 月开始——这是能够谈论黄金价格行为的起点。
先看最直白的一张图:把黄金价格与累计通胀画在一起。结论出乎很多人意料——黄金不是"跑平"通胀,而是大幅跑赢。
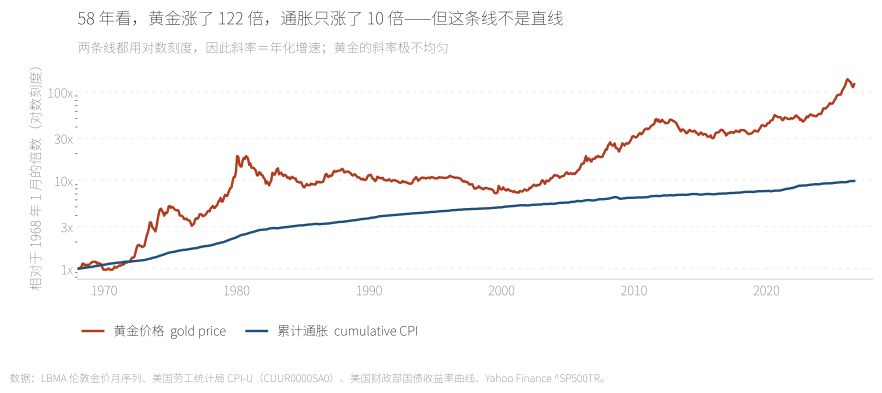
两条线都用对数刻度,所以斜率就是年化增速。黄金名义价格 58 年涨了 122 倍(年化 8.6%),同期 CPI 涨了 9.8 倍(年化 4.0%)。差距很惊人,但请注意斜率极不均匀:1970 年代那段几乎是垂直的,1980 到 2000 年那段则几乎水平——同样 20 年,两种完全不同的体验。
Both lines are on a log scale, so the slope is the annualised growth rate: gold rose 122-fold (8.6% a year), CPI 9.8-fold (4.0%). Note how uneven the slopes are — near-vertical in the 1970s, almost flat from 1980 to 2000.
来源:LBMA 伦敦金价月序列与美国 CPI-U。Source: LBMA London gold price and US CPI-U.
02换个尺子:实际购买力A different yardstick: real purchasing power
名义价格会骗人,真正要问的是:持有黄金能不能保住购买力。把金价除以同月的 CPI,就得到黄金的实际购买力指数(1968 年 1 月=1)。这条线才是这篇笔记的核心。
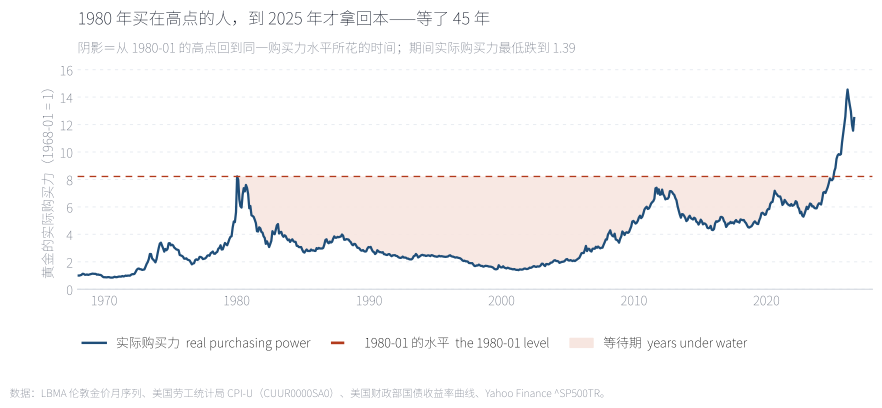
今天这个指数是 12.5,历史最高 14.6(2026-02)。但看形状:1980 年 1 月它到过 8.22,随后一路跌到 2001 年 4 月的 1.39——实际购买力跌掉 83%;再回到 1980 年那个水平,要等到 2025 年 2 月。也就是说,1980 年初买入黄金的人,需要等 45 年才追平购买力。这就是"黄金抗通胀"这句话最大的问题:它成立,但成立的时间尺度长过大多数人的投资生涯。
The index stands at 12.5 today against a peak of 14.6. But look at the shape: it reached 8.22 in January 1980, fell to 1.39 by April 2001 — an 83% loss of purchasing power — and did not return to the 1980 level until February 2025, a 45-year wait.
来源:本文计算,金价 ÷ 同月 CPI,1968-01 = 1。Source: author's calculations; gold price ÷ same-month CPI, January 1968 = 1.
03你不可能持有 58 年You cannot hold for 58 years
"长期跑赢通胀"这个结论本身没问题,问题是它对个人投资者几乎不可用——因为没有人能选择自己的起点。更实际的问题是:如果我在历史上任意一个月买入,持有 N 年,实际亏钱的概率有多大?把每一个月末都当作起点滚动计算,答案如下。
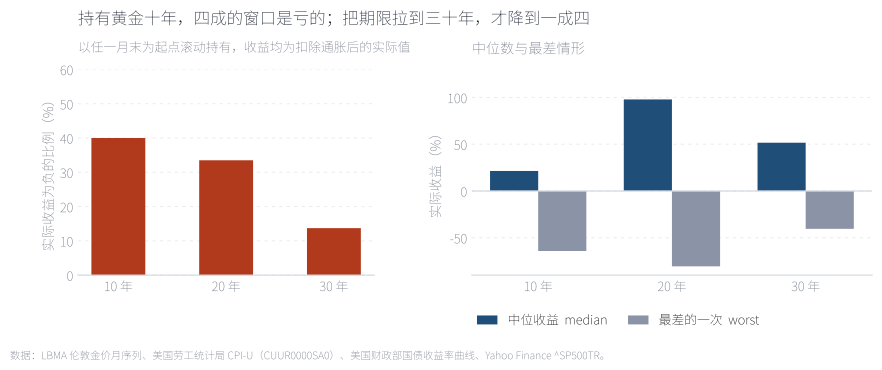
持有 10 年:40.0% 的窗口实际收益为负,最差的一次是 −64.2%(1980 年前后入场)。持有 20 年:33.5% 为负,最差 −80.6%。把期限拉到 30 年,为负比例降到 13.7%。注意这是一个很强的结论:即使持有二十年,三分之一的起点仍然是亏的——"长期"要长到三十年才开始接近稳妥。
Over ten years, 40.0% of windows lost money in real terms, the worst at −64.2%. Over twenty years 33.5% were negative, the worst −80.6%. Only at thirty years does the share fall to 13.7%.
来源:本文计算,以任一月末为起点滚动持有。Source: author's calculations, rolling every month-end start.
04短期里,通胀和黄金几乎没关系In the short run the link is weak
如果黄金真是通胀对冲,那么通胀高的年份它应该涨。把 1969 年以来每一年的 CPI 同比与当年金价变动放在一起,会看到一种很松的关系。
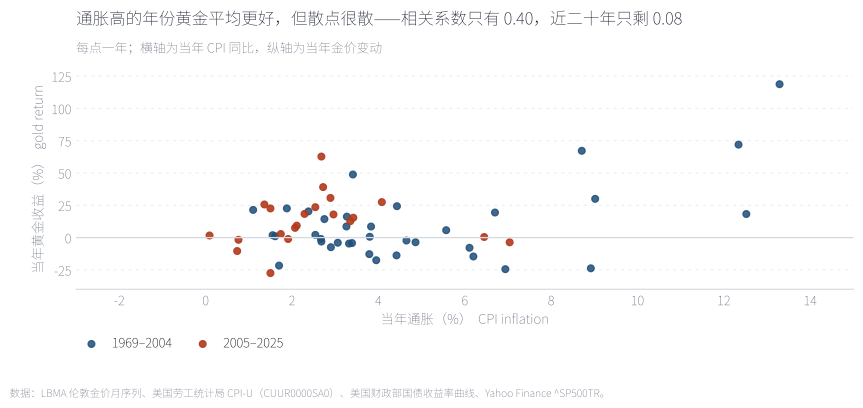
全样本相关系数 0.40——有正向关系,但远谈不上"对冲"。更关键的是近二十年:2005 年之后相关系数只剩 0.08,几乎可以当作没有关系。也就是说,那些最常被引用的"黄金抗通胀"证据,几乎全部来自 1970 年代那一段。
The full-sample correlation is 0.40 — positive, but far from a hedge. Since 2005 it is just 0.08. Most of the evidence usually cited comes from the 1970s.
来源:本文计算,每年 12 月同比。Source: author's calculations, December-on-December.
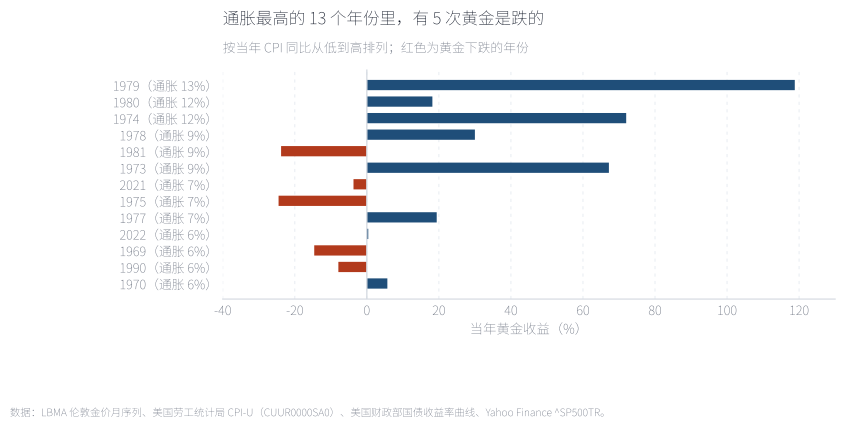
红色的是黄金下跌的年份,13 次里有 5 次。其中 2022 年最值得记住:当年美国通胀 6.5%,是四十年最高,而黄金只涨了 0.4%——扣掉通胀后实际购买力缩水约 6%。如果一个人买黄金就是为了防通胀,2022 年是最该奏效的一年,它却没有奏效。(同一年 10 年期 TIPS 实际收益率从 −1% 升到 +1.5%。)
Red bars are years in which gold fell — five out of thirteen. The one to remember is 2022: US inflation at a 40-year high of 6.5% and gold up just 0.4%, a real loss of about 6%. That was the year the thesis was supposed to work.
来源:本文计算;实际利率为美国财政部 10 年期 TIPS。Source: author's calculations; real rate from the US Treasury 10-year TIPS curve.
05那黄金到底在对冲什么So what does gold hedge?
解释黄金的经典框架来自 Gibson 悖论:在金本位下,金价与物价水平反向变动,而连接两者的是实际利率。放到今天,逻辑是:黄金不产生任何现金流,持有它的机会成本就是"本该拿到的实际利率"。实际利率越低,持有黄金越不亏,金价越高。[4][5] 这解释了两个看似矛盾的现象——1970 年代和 2020 年前后黄金大涨,共同点是实际利率为负;而 2022 年通胀虽高,实际利率却在快速上行,黄金因此横盘。
学术上还有一个更精确的区分:黄金是"hedge"(平时与股票不相关)还是"safe haven"(危机时与股票负相关)。Baur 与 Lucey(2010)用美国数据发现黄金同时具备两者,而 Baur 与 McDermott(2010)在国际样本上发现"安全港"属性只在部分市场、部分时期成立。[2][3] Erb 与 Harvey(2013)的《The Golden Dilemma》则直接质疑通胀对冲的说法:他们发现金价与实际利率、以及与通胀的关系都不稳定,没有任何一个价位可以保证未来的实际收益。[1]
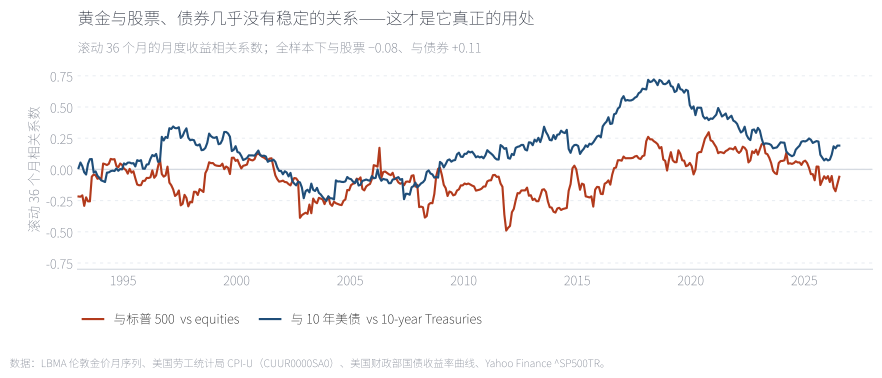
滚动 36 个月的相关系数在正负之间来回摆动,全样本下与标普 500 是 −0.08、与 10 年期美债是 +0.11。这里面没有稳定的规律——而这恰恰是它的价值:不是因为它"总在对冲什么",而是因为它和你的其他持仓不同步。
The rolling 36-month correlation swings between positive and negative. Full-sample it is −0.08 against the S&P 500 and +0.11 against 10-year Treasuries. There is no stable rule here — which is exactly the point.
来源:本文计算,月频收益,1990-01 起。Source: author's calculations, monthly returns from January 1990.
06所以它该被放在哪一栏Which column does it belong in
如果黄金不是通胀保险,那它在组合里算什么?答案是分散化资产。下面把黄金按 0% 到 40% 的权重加进一个 60/40 组合(用 10 年期国债近似债券),看会发生什么。
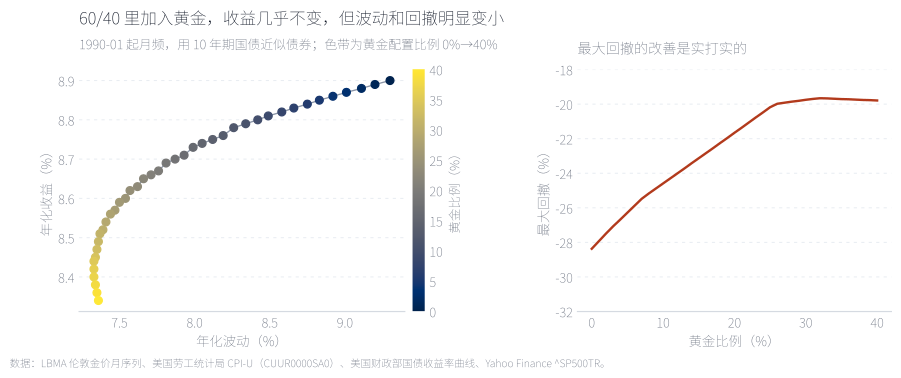
左图是"波动—收益"平面,颜色是黄金比例。年化收益几乎不动(8.9% → 8.7%),但波动从 9.3% 一路降到 7.8%,点在图上向左平移。右图是最大回撤:从 −28.4% 改善到 −26.3%(5%)、−24.6%(10%)、−21.7%(20%)。单位波动的收益从 0.96 升到 1.12。这就是黄金真正的用处:它买的不是抗通胀,是回撤。
Annualised return barely moves (8.9% → 8.7%) while volatility falls from 9.3% to 7.8%, and the maximum drawdown improves from −28.4% to −24.6% at a 10% weight. Return per unit of risk rises from 0.96 to 1.12.
来源:本文回测,1990-01 起月频;债券用 10 年期国债收益率近似(久期 7.5),不扣交易成本。Source: author's backtest, monthly from January 1990; bonds approximated from the 10-year Treasury yield (duration 7.5), before costs.
拖动滑块改变黄金权重。上图是组合的累计净值(虚线为不含黄金的 60/40),下图是对应的回撤路径。可以试三个位置:0%——回撤最深;10%——收益几乎没损失而回撤明显变浅;40%——回撤最小,但年化已经开始被拖累。结论不是"越多越好",而是存在一个位置,你几乎不花钱就买到了更平稳的路径。
Drag the weight. The dashed line is the 60/40 without gold. At 0% the drawdown is deepest; at 10% you give up almost no return for a visibly shallower one; by 40% the return starts to suffer. The point is not "more is better" but that a range exists where smoother comes nearly free.
来源:本文回测,数据见附录 A。Source: author's backtest; data in Appendix A.
07结论:它对冲的是时间,不是数字Conclusion: it hedges time, not a number
把三层结论放在一起,可以得到一个比原命题更精确的说法。方向没错:58 年尺度上黄金确实跑赢通胀,实际购买力 12.5 倍。但尺度是全部:10 年持有有四成窗口亏损,20 年三成,30 年才降到一成四;1980 年高点要等 45 年回本。而机制被误读了:黄金不是通胀挂钩债券,它是零息资产,价格由实际利率和货币信用决定,所以通胀高不必然推高金价——1981 年和 2022 年都是反例。
更实用的表述是:把黄金放在"分散化"那一栏,不要放在"通胀保险"那一栏。配置它的理由是它与股债的低相关(−0.08 与 +0.11),结果是更浅的回撤(−28.4% → −24.6%)而不是更高的收益;比例上,5%–10% 就能拿到大部分回撤改善,超过 20% 开始付出收益代价。最重要的是不要用它做通胀择时——那正是它最不可靠的一项用途。
最后是边界。样本从 1968 年开始,而这 58 年恰好是法币与黄金脱钩、实际利率整体下行的时期,黄金的相对表现可能因此被高估;债券收益用国债收益率近似,没有考虑真实债券基金的费率与跟踪误差;组合回测未扣交易成本。如果未来出现长期的正实际利率环境,"实际购买力 12 倍"这个结论很可能显著收缩。
Full English version below.
English version
Question. "Gold is an inflation hedge" is repeated so often that it is rarely tested. We test it on 703 monthly observations of the LBMA London gold price and US CPI from January 1968 — the point at which the gold price became market-determined — to August 2026.
Result 1 — over 58 years it is true. Gold rose 122-fold in nominal terms while CPI rose 9.8-fold, lifting real purchasing power 12.5 times (peak 14.6 in February 2026). Anyone looking only at this number would conclude the claim holds.
Result 2 — the time scale is the whole story. The real purchasing-power index reached 8.22 in January 1980 and fell to 1.39 by April 2001, an 83% loss, and did not regain the 1980 level until February 2025 — a 45-year wait. Rolling real returns are negative in 40.0% of ten-year windows, 33.5% of twenty-year windows and 13.7% of thirty-year windows.
Result 3 — the short-run link is weak. The correlation between annual inflation and gold returns is 0.40 across the full sample but only 0.08 since 2005. Gold fell in five of the thirteen highest-inflation years. In 2022, with US inflation at 6.5%, gold rose 0.4% — a real loss of about 6%.
Mechanism. Gold pays no cash flow, so the opportunity cost of holding it is the real interest rate. This is the modern reading of Gibson's Paradox: gold does well when real rates are negative or falling (the 1970s, 2011, 2020) and stalls when inflation is high but real rates are rising (1981, 2022). Erb and Harvey (2013) show the relationship is unstable enough that no price level guarantees a future real return.
Portfolio role. Gold's monthly correlation is −0.08 with the S&P 500 and +0.11 with 10-year Treasuries, with no stable sign over time. Adding 10% to a 60/40 leaves the annualised return at 8.8% (from 8.9%) while cutting volatility from 9.3% to 8.4% and the maximum drawdown from −28.4% to −24.6% (1990–2026, monthly).
Implication. Put gold in the diversification column, not the inflation-insurance column. Size it at 5–10% to capture most of the drawdown improvement, and do not use it to time inflation. Limitations: the sample covers a single era of negative-to-low real rates; bond returns are approximated from the Treasury yield curve; no transaction costs.
附录 A · 数据、方法与来源Appendix A · data, method and sources
数据。伦敦金价月序列(LBMA,1968-01 至 2026-08,703 个月)取自 datahub.io 的公开数据集;美国 CPI-U(CUUR0000SA0)取自美国劳工统计局公开 API;10 年期名义与实际(TIPS)国债收益率取自美国财政部官网的收益率曲线文件;标普 500 全收益月度序列与《定投还是 all-in》一篇共用。访问日期 2026-10-03。
做法。实际购买力指数 = 金价 ÷ 同月 CPI,起点 1968-01=1。滚动实际收益:以任一月末为起点,计算持有 N 年后实际购买力指数的变化。年度口径取每年 12 月的同比。组合回测用 60% 标普 500 全收益、40% 10 年期国债,黄金按给定权重从两者中按比例扣除;债券月收益近似为「票息/12 − 7.5 × 收益率变化」。
未计入。交易成本、税费、实物黄金的保管与买卖价差,以及不同投资者面对的黄金工具差异(实物、ETF、期货)。债券部分用收益率曲线近似,未计入真实债券基金的费率与跟踪误差。
代码。tools/fetch_gold_raw.py(取数)、tools/make_gold_data.py(全部统计)、tools/make_gold_figs.py(七张图)、tools/make_gold_note.py(本页与交互图)。固定输入可完全复现。
Data. LBMA London gold price, monthly (January 1968 – August 2026, 703 months), from the public datahub.io dataset; US CPI-U (CUUR0000SA0) from the BLS public API; 10-year nominal and real (TIPS) Treasury yields from the US Treasury yield-curve files; S&P 500 total return monthly series shared with the DCA note. Accessed 3 October 2026.
Method. The purchasing-power index is gold ÷ same-month CPI, set to 1 in January 1968. Rolling real returns compute the change in that index over N years from every month-end start. Annual figures are December-on-December. The portfolio backtest holds 60% S&P 500 total return and 40% 10-year Treasuries, funding gold pro rata from both; the monthly bond return is approximated as coupon/12 − 7.5 × change in yield.
Not included. Transaction costs, taxes, storage and bid-offer on physical metal, and the differences between gold vehicles (physical, ETF, futures). Bonds are approximated from the yield curve, ignoring fund fees and tracking error.
Code. tools/fetch_gold_raw.py (download), tools/make_gold_data.py (all statistics), tools/make_gold_figs.py (seven figures), tools/make_gold_note.py (this page and the interactive chart).
附录 B · 三个容易被忽略的口径问题Appendix B · three measurement problems
一、起点决定了结论。1968 年之前金价由官方固定,"黄金价格行为"无从谈起;本文样本开始于伦敦金池瓦解之后。而 1968 年至今恰好是实际利率整体下行的时期,这对黄金有利。换一个起点(例如从 1980 年开始),"实际购买力 12 倍"会立刻消失。
二、用哪国的通胀。本文用美国 CPI,因为金价以美元计价、数据也最长。对一个以港币或人民币计价的投资者,还要叠加汇率:美元走强时,本币计价的黄金涨幅会明显小于美元计价。
三、黄金不是无风险的实物。回测用的是伦敦金价定盘价,不含 ETF 费率、保管费与买卖价差。对长期持有者,每年 0.2%–0.4% 的成本会在三十年里累积成可观的一笔。
One: the start date decides the answer. Before 1968 the gold price was administratively fixed, so nothing can be said about its behaviour. Our sample begins after the collapse of the London Gold Pool — and that period happens to coincide with a long decline in real rates, which flatters gold. Start in 1980 instead and the "12-fold real gain" disappears.
Two: whose inflation. We use US CPI because gold is priced in dollars and the data is longest. For a Hong Kong or mainland investor, FX sits on top: when the dollar strengthens, gold in local currency lags the dollar return.
Three: gold is not costless. The backtest uses the London fixing, excluding ETF fees, storage and bid-offer. At 0.2–0.4% a year, that compounds into a meaningful amount over thirty years.
参考文献References
- Erb, C. B., & Harvey, C. R. (2013). The Golden Dilemma. Financial Analysts Journal, 69(4), 10–42. doi.org/10.2469/faj.v69.n4.1
- Baur, D. G., & Lucey, B. M. (2010). Is Gold a Hedge or a Safe Haven? An Analysis of Stocks, Bonds and Gold. Financial Review, 45(2), 217–229. doi.org/10.1111/j.1540-6288.2010.00244.x
- Baur, D. G., & McDermott, T. K. (2010). Is gold a safe haven? International evidence. Journal of Banking & Finance, 34(8), 1886–1898. doi.org/10.1016/j.jbankfin.2009.12.008
- Barsky, R. B., & Summers, L. H. (1988). Gibson's Paradox and the Gold Standard. Journal of Political Economy, 96(3), 528–550. doi.org/10.1086/261550
- Batten, J. A., Ciner, C., & Lucey, B. M. (2010). The macroeconomic determinants of volatility in precious metals markets. Resources Policy, 35(2), 65–71. doi.org/10.1016/j.resourpol.2009.12.002
- 行情与宏观数据:LBMA 伦敦金价(datahub.io)、美国劳工统计局 CPI-U、美国财政部收益率曲线、Yahoo Finance ^SP500TR,访问日期 2026-10-03。Market and macro data: LBMA London gold price (datahub.io), US BLS CPI-U, US Treasury yield curve, Yahoo Finance ^SP500TR, accessed 3 October 2026.