VIX 冲上 30 的时候,该贪婪吗?When VIX tops 30, should you be greedy?
「别人恐惧我贪婪」是这个市场里流传最广的一句话,落到指标上就变成一条可执行的规则:VIX 高的时候买入。本文用 1990-02 至 2026-09 共 440 个月的月度数据检验这句话。在收益层面它站得住——VIX ≥ 30 之后的 12 个月,标普 500 全收益的中位数是 21.8%,明显高于低波动区间的 13.6%;但代价在样本上:36 年半里这样的机会只有 7 个互不重叠的市场阶段,其中一次(2001–2003)买入后两年仍在亏损。我们的结论是:VIX 是一个有用的风险定价读数,不是一个可执行的入场信号。 "Be greedy when others are fearful" is one of the most repeated lines in investing; reduced to a rule it becomes buy when VIX is high. We test it on 440 monthly observations from February 1990 to September 2026. It holds on returns — the median 12-month return after VIX ≥ 30 is 21.8%, against 13.6% after the calmest periods. The cost is in the sample: 36 years produced only seven non-overlapping episodes, one of which (2001–2003) was still losing money two years later. Our conclusion: VIX is a useful risk-pricing gauge, not an executable entry signal.
- VIX ≥ 30 之后的 12 个月,标普 500 中位收益 21.8%,高于 VIX < 15 之后的 13.6%——这句话在收益层面成立。 The median 12-month return after VIX ≥ 30 is 21.8%, against 13.6% after VIX < 15 — the maxim holds on returns.
- 33 个「高 VIX 月份」合并后只剩 7 个市场阶段:真正独立的机会是 7 次,不是 33 次,更不是 440 次。 The 33 "high-VIX months" collapse into seven market episodes: seven independent chances, not 33, and certainly not 440.
- 7 次里有 1 次是亏的:2001-09 → 2003-01,其间任一月末入场,一年后的中位收益是 −8.1%。 One of the seven lost money: September 2001 to January 2003, where the median outcome twelve months later was −8.1%.
- 把风险放回分母,结论就反转:事前口径下 VIX < 15 区间的单位波动收益最高(1.05),VIX ≥ 30 只有 0.63。 Put risk back in the denominator and it reverses: per unit of risk the calmest bucket earns 1.05, the VIX ≥ 30 bucket only 0.63.
关键词 VIX · 隐含波动率 · 方差风险溢价 · 择时 · 多资产配置 · 行为偏差Keywords VIX · implied volatility · variance risk premium · market timing · multi-asset allocation · behavioural bias
01这句话是从哪来的Where the maxim comes from
把「别人恐惧我贪婪」翻译成可检验的语言,需要先找到「恐惧」的度量。1993 年 Cboe 推出 VIX 之后,Whaley(2000)把它称作投资者恐惧指标(investor fear gauge),这个绰号流传至今,也把「VIX 高」与「该贪婪」在直觉上绑在了一起。但这两件事在逻辑上并不等价:VIX 高只说明市场为波动率保险付了更高的价格,它并不直接说明股票接下来会涨。
更麻烦的是,这句话有几种不同的读法,而它们的可检验性完全不同。读法一:VIX 高时买入,长期收益更高——这是一个可以用数据回答的问题。读法二:VIX 高时买入更安全——这与"高波动"直接矛盾,但很多人心里想的是这个。读法三:VIX 高时买入是更好的风险调整后选择。本文只回答第一和第三个,因为它们可以被证伪。
在进入数据之前,先看这句话碰到的是什么形状的东西。下图把 1990 年以来的 VIX 全序列画了出来,并把所有「VIX ≥ 30」的时段标成阴影。
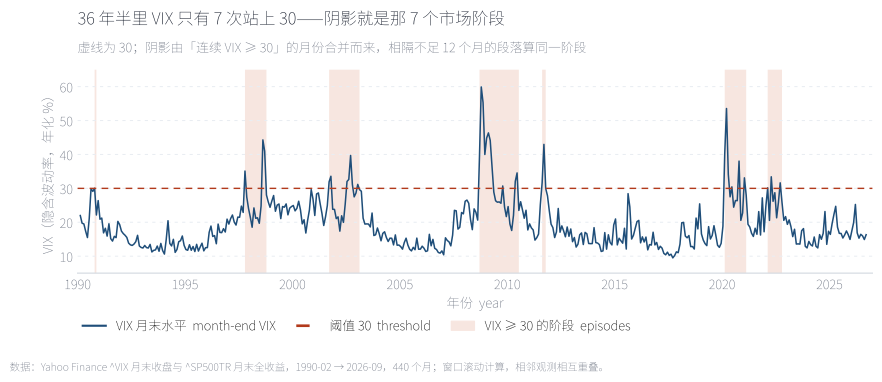
阴影是 VIX ≥ 30 的月份合并后的结果,一共 7 段。它们不是均匀出现的:1997–2003 有 3 段,2008–2011 有 2 段,2020 与 2022 各 1 段。也就是说,这不是一个每年都会给你机会的规则,而是一个十年才出现两三次的事件。这个形状本身就预示了后面所有统计问题。
The shaded bands are the seven episodes where VIX stayed at or above 30. They are not evenly spaced: three fall between 1997 and 2003, two between 2008 and 2011, and one each in 2020 and 2022.
来源:Yahoo Finance,^VIX 月末收盘。Source: Yahoo Finance, month-end ^VIX close.
02VIX 到底是什么What VIX actually measures
VIX 不是"恐慌指数"这个绰号所暗示的情绪读数,它是一个价格。它由一篮子标普 500 期权价格反推得到,含义是:期权市场对未来 30 天年化波动率的定价。换句话说,它衡量的是市场愿意为波动率保险支付多少钱,而不是市场有多害怕。
这个区别在资产定价上有确切含义。Carr 与 Wu(2009)以及 Bollerslev、Tauchen 与 Zhou(2009)记录了一个稳健的事实:隐含波动率在平均水平上高于随后实现的波动率,这个差额被称为方差风险溢价(variance risk premium)。卖方卖出波动率保险承担了尾部风险,因此长期获得这笔溢价。这带来一个直接的推论:「VIX 高」可能只是意味着保险当期卖得贵,而"未来会更波动"与"未来会涨"是两件完全不同的事。
这也解释了为什么"VIX 高就该贪婪"听起来总是对、做起来总是难:如果 VIX 高是因为保险变贵了,那么买股票的理由是"保险费补偿变厚";如果 VIX 高是因为未来真的更波动,那么买股票的理由就完全不存在。数据能告诉我们的,只能是在过去这 36 年半里,哪一种情况更常见。
03第一层检验:按 VIX 水平分桶First test: bucket by VIX level
样本为 ^VIX 月末收盘与标普 500 全收益指数月度收盘,1990-02 至 2026-09 共 440 个月。对每一个月末时点  ,记下当期 VIX 水平,并计算此后 12 个月的累计总收益,再把所有时点按 VIX 水平分桶。事前的单位波动收益定义为
 ——分子是未来 12 个月收益,分母是决策时点已经知道的 VIX 水平;用未来实际发生的波动做分母的口径我们称为事后口径,两者会在第 05 节对照。
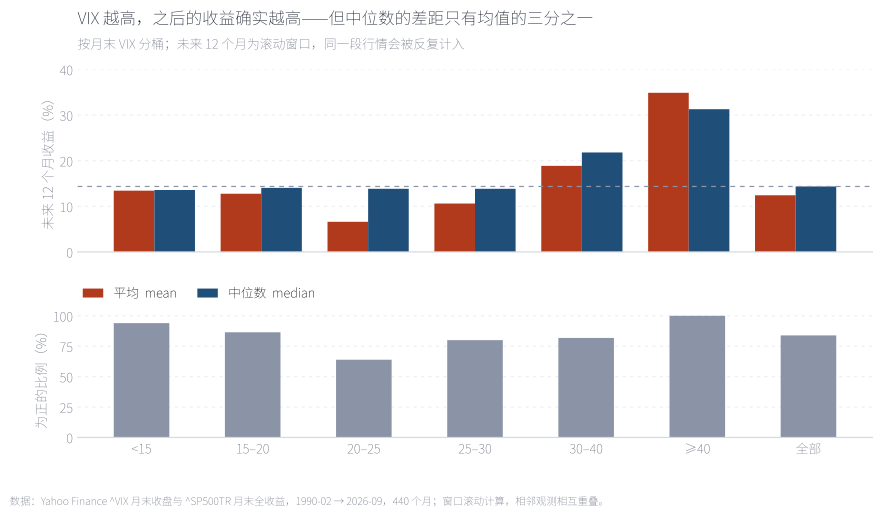
上图左右两根柱分别是均值与中位数,灰虚线是全体样本的中位数 14.3%。两个读数讲的是不同的故事:均值随 VIX 上升的幅度远大于中位数——VIX ≥ 40 那一组的均值被少数几次极端反弹拉高。下图的"为正的比例"则显示,高 VIX 并不等于更稳:胜率最高的是最平静的那一档。
Bars compare mean and median 12-month forward returns by VIX bucket. The mean rises much faster than the median, which is what a handful of extreme rebounds would do to a small sample.
来源:本文计算,数据见附录 A。Source: author's calculations; data in Appendix A.
| 持有窗口Horizon | VIX <15 | 15–20 | 20–25 | 25–30 | 30–40 | ≥40 |
|---|---|---|---|---|---|---|
| 未来 1 个月1 months | 1.2 | 1.4 | 1.4 | 1.0 | 4.7 | 6.4 |
| 未来 3 个月3 months | 3.0 | 3.5 | 3.3 | 5.6 | 7.6 | 11.8 |
| 未来 6 个月6 months | 6.2 | 6.0 | 5.3 | 9.0 | 13.3 | 25.9 |
| 未来 12 个月12 months | 13.6 | 14.1 | 13.8 | 13.8 | 21.8 | 31.3 |
数值为中位数,单位 %。加粗列为 VIX ≥ 30 的两档。最值得注意的是非单调:20–25 这一档的中位数不但不高于低波动档,反而是整张表里偏低的一行——"半恐慌"既没有高赔率,也没有低波动。
Medians in per cent. The bolded column is VIX ≥ 30. The striking feature is the lack of monotonicity: the 20–25 bucket is one of the weakest rows in the table.
04第二层检验:你其实只有七次机会Second test: how many chances did you get
上一节的结论有一个前提没被检验:那 33 个高 VIX 观测是独立的吗?答案是不独立。VIX 是高度持续的序列,一个月高,下个月通常还高。把连续月份合并成一段,33 个月变成 17 段;再考虑现实中相隔不到一年的两段其实是同一轮市场阶段,17 段进一步合并成 7 段。也就是说,在 36 年半的历史里,"VIX 站上 30"这个条件一共只发出过 7 次独立的信号。
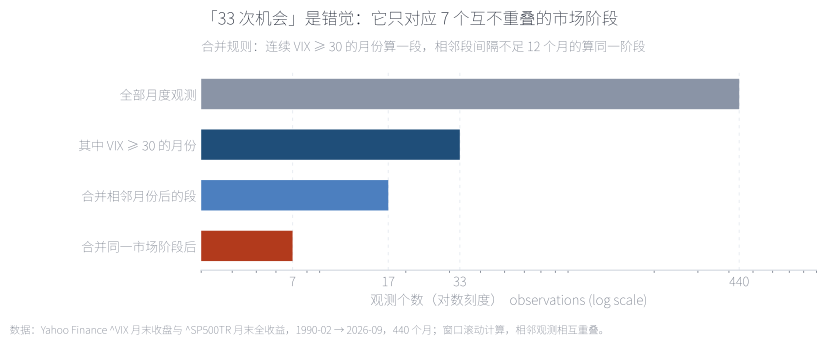
横轴为对数刻度。这一步不是在"剔除数据",而是在纠正一个统计假设:把重叠窗口当成独立观测,会系统性地夸大显著性。任何声称"VIX 择时被验证过 33 次"的说法,实际证据强度只相当于 7 次。
The x-axis is logarithmic. This is not data trimming but a correction of the independence assumption: overlapping windows are not separate draws.
来源:本文计算。Source: author's calculations.
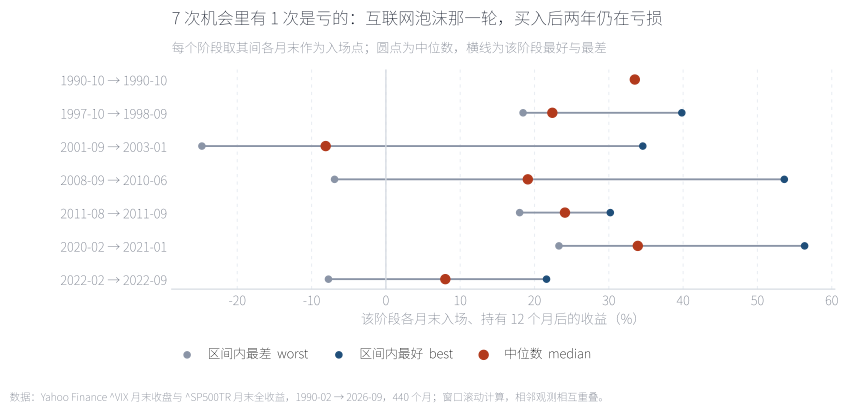
每一行是一个阶段,圆点是该阶段的 12 个月收益中位数,横线是该阶段最好与最差。2001-09 → 2003-01 是唯一整体亏损的阶段:在那 7 个月里的任何月末入场,一年后的中位收益是 −8.1%。如果你在 2001 年秋天看到 VIX 突破 30 而加仓,接下来两年你会同时承受浮亏和"这个规则很灵"的信念崩塌。
One row per episode; the dot is the median 12-month outcome for start dates inside that episode, the line spans best to worst. The dot-com episode is the only one whose median is negative.
来源:本文计算。Source: author's calculations.
| 阶段Episode | 月数Months | 峰值 VIXPeak VIX | 峰值所在月Peak month | 期间入场后 12 个月中位收益(%)Median 12-month outcome (%) |
|---|---|---|---|---|
| 1990-10 → 1990-10 | 1 | 30.0 | 1990-10 | 33.5 |
| 1997-10 → 1998-09 | 3 | 44.3 | 1997-10 | 22.4 |
| 2001-09 → 2003-01 | 7 | 39.7 | 2001-10 | -8.1 |
| 2008-09 → 2010-06 | 11 | 59.9 | 2008-10 | 19.1 |
| 2011-08 → 2011-09 | 2 | 43.0 | 2011-09 | 24.1 |
| 2020-02 → 2021-01 | 6 | 53.5 | 2020-03 | 33.9 |
| 2022-02 → 2022-09 | 3 | 33.4 | 2022-02 | 8.0 |
"月数"为该阶段内 VIX ≥ 30 的月份数,标红的一行是唯一的负数——它同时说明峰值 VIX 与后续收益之间没有稳定关系:峰值最高的 2008-10(59.9)之后是此后两年里最好的一段,峰值最低的 1990-10 之后也不错,而峰值中等、由衰退驱动的 2001–2003 反而是唯一的亏损案例。
"Months" counts the months inside each episode with VIX ≥ 30. The highlighted row is the only negative one — and it shows there is no stable link between how high VIX peaked and what followed.
05第三层检验:把风险放回分母Third test: put risk back in the denominator
到此为止,我们一直在比较收益,没有比较代价。高 VIX 之后当然可能涨得更多——如果它同时意味着更大的波动,那么"更多收益"就不是优势,而是风险的补偿。这需要把风险放在分母上,而分母有两种取法,它们给出不同的答案。
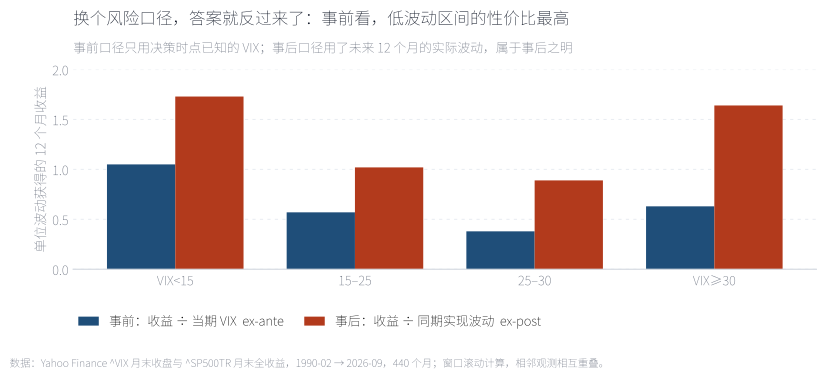
事前口径(蓝)只用决策时点已知的 VIX:低波动区间的单位波动收益最高(1.05),高 VIX 区间只有 0.63,中间地带最差。含义是——当你为波动率支付的保险费变贵时,你并没有得到相称的补偿。事后口径(橙)用未来实际发生的波动:两端接近(1.73 与 1.64),中间地带最差(0.89–1.02)。两个口径唯一的共识是:最差的从来不是高 VIX,而是"中等恐慌"。
Blue uses only information known at the decision date (VIX itself); orange uses the volatility that actually followed. Only the middle buckets look bad under both.
来源:本文计算。单位波动收益 = 未来 12 个月收益 ÷ 风险度量,未扣无风险利率。Source: author's calculations. Return per unit of risk = 12-month forward return ÷ risk measure, before any risk-free adjustment.
06把它写成规则,然后跑一遍Write it as a rule and run it
前面都是统计描述。如果这句话真能赚钱,它应该能通过一个更严格的检验:把它写成一条机械规则,加上真实的约束(不能做空、不能加杠杆、等待期没有利息收入),然后看它到底跑不跑得赢什么都不做。规则定义如下:月末 VIX ≥ 30 时,下个月满仓标普 500;VIX ≤ 20 时,下个月空仓;两者之间维持原有仓位。换手发生在越过阈值的那一个月。
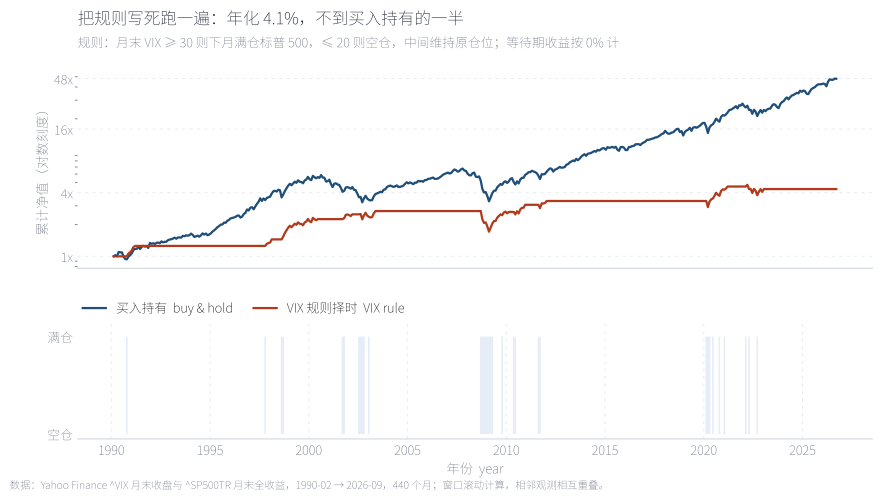
上图是对数刻度净值,下图是持仓状态。规则的累计净值只有买入持有的一小部分:年化 4.1% vs 11.2%,单位波动收益 0.42 vs 0.76。原因在下面那张图里一目了然——它只在 22.7% 的月份里持仓。这条规则没有亏钱,它只是把绝大部分上涨让了出去;而它避开的下跌,并不足以抵消被错过的时间。
Annualised return 4.1% versus 11.2% for buy-and-hold; return per unit of volatility 0.42 versus 0.76. The lower panel shows why: the rule is invested only 22.7% of the time.
来源:本文回测,不扣交易成本与税费。等待期按 0% 计息,这对择时策略偏有利。Source: author's backtest, before costs and taxes. Cash earns 0% while out of the market, which flatters the timing rule.
拖动滑块改变阈值。上图的竖线是触发点落在价格曲线上的位置,下图的柱是每次触发之后 12 个月的收益。有三个值得亲手试的位置:把阈值降到 20,触发月数从 33 涨到 161,但独立阶段只从 7 增到 8——多出来的样本几乎全是同一轮行情的重复计数;升到 40,只剩 4 个阶段和 11 个月,中位收益漂亮到 31.3%,但那个数字已经没有统计意义;留在 30,得到的是本文正文用的那一组。这就是这类规则最难说清的地方:你想让结论更好看,只需要把阈值往上推。
Drag the threshold. Lower values trigger far more often but thicken the left tail of outcomes; higher values leave too few observations to support any conclusion.
来源:本文计算,数据见附录 A。Source: author's calculations; data in Appendix A.
07机制:VIX 回归的是波动率,不是价格Mechanism: VIX mean-reverts, prices need not
如果高 VIX 之后平均收益确实更高,机制是什么?最容易想到的解释是"恐慌会消退"。这个解释对了一半——消退的确实是波动率。把每个 VIX ≥ 30 的月末对齐,看此后 12 个月的平均路径:VIX 从 37.7 一路回落到 21.4,而价格的路径远不如它稳定。
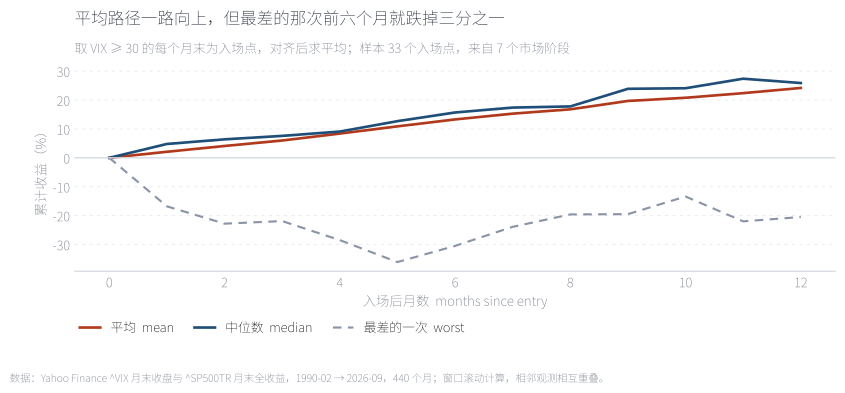
平均与中位路径都稳定向上,最终落在 24.2% 与 25.9%——与前面分桶统计一致。但虚线(最差的一次)显示,前六个月可以跌掉三分之一,而且它在第 12 个月仍未回到正收益。这就是这个策略的真实体验:平均意义上它有效,但在七次机会里,有相当概率你会经历一次长达两年的等待。VIX 从 37.7 回到 21.4 是波动率的均值回归,它不等于价格的均值回归。
Mean and median paths climb steadily to roughly 24–26%. The worst single path loses a third of its value within six months and is still underwater at month twelve. VIX reverting from 37.7 to 21.4 is volatility mean reversion, not price mean reversion.
来源:本文计算,对齐 33 个 VIX ≥ 30 的入场点(来自 7 个市场阶段)。Source: author's calculations, aligning 33 entry points with VIX ≥ 30 drawn from seven episodes.
08结论:VIX 是读数,不是信号Conclusion: a gauge, not a signal
把三层的结论放在一起,可以得到一个比原命题更精确的表述。收益层面,高 VIX 之后的中位收益确实更高(21.8% vs 13.6%),这一点在 1、3、6、12、24 个月的窗口上都成立,不是某一种口径的产物。证据层面,支撑它的独立样本只有 7 个,其中一个是亏损的;任何把 33 当样本量、更不用说把 440 当样本量的说法,都在系统性地夸大证据强度。风险调整层面,如果以决策时点可获得的信息衡量,高 VIX 区间的性价比反而更低。
因此更实用的结论是:不要用 VIX 决定方向,用它决定风险预算。VIX 是一个高质量的风险定价读数——它告诉你波动率保险有多贵、市场对未来波动的共识是多少,这些信息可以用来调整仓位规模、设定止损距离、给风险预算定标;它不告诉你下个月涨还是跌。把波动率当旋钮而不是当成预言,是这 36 年半数据给出的、最稳健的那部分经验。
最后要诚实地说明这份结论的边界。样本只有一个市场、一个 36 年半的窗口,其中 1990 年代以后的低利率环境可能系统性地压低了 VIX 的中枢;月度取样会漏掉月内的极端波动;未来收益窗口高度重叠。如果未来出现一轮利率中枢更高、波动率定价更贵的周期,第 05 节的"事前口径"结论很可能被改变——而那正是这篇文章最该被质疑的地方。
Full English version below.
English version
Question. "Be greedy when others are fearful" is one of the most repeated lines in investing. Reduced to a tradeable rule it becomes: buy equities when VIX is high. We test that rule on 440 monthly observations of the ^VIX month-end level and the S&P 500 total return index from February 1990 to September 2026.
Result 1 — it holds on returns. The median 12-month forward return is 21.8% after VIX ≥ 30, against 13.6% after VIX < 15. The pattern is not monotone, however: the 20–25 bucket is the weakest row in the table, so "half-fear" is neither a high-payoff nor a low-volatility state.
Result 2 — the sample is tiny. The 33 months with VIX ≥ 30 collapse to 17 non-overlapping runs once consecutive months are merged, and to 7 market episodes once runs less than twelve months apart are treated as one. One of the seven — September 2001 to January 2003 — has a negative median outcome of −8.1%. Every claim of the form "this signal was tested 33 times" actually rests on seven independent draws.
Result 3 — risk adjustment reverses it. Dividing the forward return by the VIX level known at the decision date, the low-volatility bucket earns the most per unit of risk (1.05) and the VIX ≥ 30 bucket only 0.63. Using realised forward volatility instead brings the two extremes close together (1.73 and 1.64); under both measures the middle buckets are the worst.
Result 4 — the rule loses to doing nothing. A mechanical rule — fully invested when month-end VIX ≥ 30, in cash below 20, unchanged in between — returns 4.1% annualised against 11.2% for buy-and-hold, with 0.42 versus 0.76 return per unit of volatility. It is invested only 22.7% of the time. It avoids drawdowns, but the missed exposure costs far more.
Mechanism. Aligning on every month-end with VIX ≥ 30, the average VIX path falls from 37.7 to 21.4 over the following year, while the average price path climbs to 24.2% and the worst single path is still down about 20% at month twelve. VIX mean reverts because volatility clusters; prices do not inherit that property.
Implication. Use VIX as a risk-pricing input — position sizing, risk budgeting, the cost of insurance — not as a directional signal. Limitations: one market, one 36-year window, monthly sampling, and heavily overlapping forward windows.
附录 A · 数据、方法与来源Appendix A · data, method and sources
数据。^VIX 月末收盘(1990-02 → 2026-09,440 个月)与标普 500 全收益指数 ^SP500TR 月末收盘,均来自 Yahoo Finance 公开行情接口,访问日期 2026-10-03。VIX 序列取月末收盘值,而非月内最高或月均,以保证决策时点不使用未来信息。
做法。对每一个月末 t 记录 VIX_t,并计算未来 h ∈ {1,3,6,12,24} 个月的总收益 P(t+h)/P(t) − 1。按 VIX 水平分为 6 档统计中位数、均值、分位数与为正比例。「独立阶段」的定义是:先把 VIX ≥ 30 的连续月份合并成段,再把相邻间隔不足 12 个月的段落视为同一阶段。
两个风险口径。事前口径的分母是决策时点已知的 VIX_t;事后口径的分母是该窗口内实现波动率的年化值(月度收益标准差 × √12)。两者都不是严格的夏普比率:未扣无风险利率,也没有考虑仓位可调整。
未计入。交易成本、税费、股息再投资的时间差,以及择时策略在空仓期的现金收益(本文按 0% 计,这对择时策略偏有利)。
代码。tools/fetch_vix_raw.py(取数)、tools/make_vix_data.py(全部统计)、tools/make_vix_figs.py(八张图)、tools/make_vix_note.py(本页与交互图)。固定输入可完全复现。
Data. Month-end ^VIX closes (Feb 1990 → Sep 2026, 440 months) and month-end ^SP500TR closes, both from the Yahoo Finance public chart endpoint, accessed 3 October 2026. The month-end close is used rather than the intra-month high or the monthly average, so that no decision point uses future information.
Method. For every month-end t we record VIX_t and compute the forward h-month total return P(t+h)/P(t) − 1 for h ∈ {1,3,6,12,24}. Observations are sorted into six VIX buckets and we report medians, means, percentiles and the share of positive outcomes. An "episode" is defined by first merging consecutive months with VIX ≥ 30 into runs, then treating runs less than twelve months apart as the same episode.
Two risk measures. The ex-ante denominator is VIX_t, known at the decision date; the ex-post denominator is the annualised realised volatility inside the window (standard deviation of monthly returns × √12). Neither is a strict Sharpe ratio: no risk-free rate is subtracted and no position sizing is modelled.
Not included. Transaction costs, taxes, the timing difference on dividend reinvestment, and the interest earned on cash while out of the market (assumed 0%, which flatters the timing rule).
Code. tools/fetch_vix_raw.py (download), tools/make_vix_data.py (all statistics), tools/make_vix_figs.py (eight figures), tools/make_vix_note.py (this page and the interactive chart). The same inputs reproduce the same output.
附录 B · 三个容易被忽略的口径问题Appendix B · three measurement problems worth stating
一、窗口重叠。滚动 12 个月的窗口里,相邻两个观测共享 11 个月的数据。这会让统计量的有效样本量远小于观测个数,也让"显著性"变得不可信。本文用"合并市场阶段"的方式给出一个保守的下界。
二、月末取样。VIX 在月内的波动可能远大于月末水平。用月末值是为了避免前视偏差,代价是漏掉了月内的极端情形——1987 年 10 月、2010 年闪崩这类事件在月频数据里几乎看不到。
三、单一市场与单一时代。样本只有标普 500,且 1990 年以后的利率下行环境可能系统性地压低了 VIX 中枢。把同样的规则放到日经或欧洲股指上,结论未必一致;这一点本文没有做,是明确的局限。
One: overlapping windows. Adjacent observations in a rolling twelve-month window share eleven months of data, so the effective sample is far smaller than the observation count and "statistical significance" is not trustworthy. Merging episodes gives a deliberately conservative lower bound.
Two: month-end sampling. Intra-month VIX can move far more than the month-end level. Using month-end values avoids look-ahead bias but misses intra-month extremes — October 1987 or the 2010 flash crash are almost invisible in monthly data.
Three: one market, one era. The sample is the S&P 500 only, and the falling-rate environment after 1990 may have systematically suppressed the level of VIX. The same rule applied to the Nikkei or European equities need not agree; we do not test that, and it is a clear limitation.
参考文献References
- Whaley, R. E. (2000). The Investor Fear Gauge. Journal of Portfolio Management, 26(3), 12–17. doi.org/10.3905/jpm.2000.319728
- Whaley, R. E. (1993). Derivatives on Market Volatility: Hedging Tools Long Overdue. Journal of Derivatives, 1(1), 71–84. doi.org/10.3905/jod.1993.407868
- Carr, P., & Wu, L. (2009). Variance Risk Premiums. Review of Financial Studies, 22(3), 1311–1341. doi.org/10.1093/rfs/hhn038
- Bollerslev, T., Tauchen, G., & Zhou, H. (2009). Expected Stock Returns and Variance Risk Premia. Review of Financial Studies, 22(11), 4463–4492. doi.org/10.1093/rfs/hhp008
- Bollerslev, T., Todorov, V., & Xu, L. (2015). Tail Risk Premia and Return Predictability. Journal of Financial Economics, 118(1), 113–134. doi.org/10.1016/j.jfineco.2015.02.010
- Coval, J. D., & Shumway, T. (2001). Expected Option Returns. Journal of Finance, 56(3), 983–1009. doi.org/10.1111/0022-1082.00352
- Simon, D. P., & Wiggins, R. A. (2001). S&P Futures Returns and Contrary Sentiment Indicators. Journal of Futures Markets, 21(5), 447–462. doi.org/10.1002/fut.4
- 行情数据:Yahoo Finance,^VIX 与 ^SP500TR 月末收盘序列,访问日期 2026-10-03。Market data: Yahoo Finance, month-end ^VIX and ^SP500TR series, accessed 3 October 2026.