负债驱动的资产配置:换一个分母,排序就变了Liability-driven allocation: change the denominator and the ranking changes
组合优化默认的目标是「资产涨得多」。但如果投资者背后站着一笔负债——保险的偿付、养老金的给付——目标就变成「比负债涨得多,而且稳」。本文用 1993-02 至 2025-09 共 392 个月的美国数据,把一笔 20 年期定额年金当作负债,让七个组合跑同一段历史。结果不是「负债让收益变低」,而是排序整个换了一遍:资产端夏普第一的 1/N 等权(0.71)在盈余端排第五;资产端夏普垫底的久期匹配(0.26),盈余波动只有 2.15%、funding ratio 最大回撤只有 −2.4%——而纯股是 −58.9%。 Portfolio optimisation assumes the objective is "make the assets grow". If the investor stands behind a liability — an insurer's claims, a pension's benefit payments — the objective becomes "grow faster than the liability, and steadily". This note gives seven portfolios the same 392 months of US data, from February 1993 to September 2025, with a 20-year level annuity as the liability. The result is not that the liability lowers your return; it is that the ranking is rewritten. The best asset-only Sharpe, 1/N at 0.71, ranks fifth on surplus; the worst asset-only Sharpe, duration matching at 0.26, delivers 2.15% surplus volatility and a −2.4% maximum drawdown in the funding ratio — against −58.9% for all-equities.
- 负债不是常数。10 年期收益率从 6.4% 走到 3.6%,同一笔年金负债的现值涨了 27%,修正久期在 7.9–9.9 年之间漂。任何用「固定目标」做的资产配置,都在跟一个会动的分母比。 The liability is not a constant. As the 10-year yield moved from 6.4% to 3.6%, the present value of the same annuity rose 27% and its modified duration drifted between 7.9 and 9.9 years. Any allocation measured against a fixed target is racing a moving denominator.
- 久期缺口就是盈余风险,而且是一条 U 形线。资产久期为 0 时,盈余波动 7.54%;逐月把资产久期对准负债久期(约 9 年)降到 2.19%;再往上加久期,波动重新上升。 The duration gap is the surplus risk, and it traces a U. At zero asset duration surplus volatility is 7.54%; matching asset duration to the liability (about nine years) takes it to 2.19%; adding duration beyond that pushes it back up.
- 换一个纵轴,排序就换了一遍。资产端:1/N 夏普 0.71 第一,久期匹配 0.26 垫底。盈余端:久期匹配的盈余波动 2.15% 排第二,1/N 的 6.96% 排第五,纯股的 17.71% 垫底。 Change the vertical axis and the ranking changes with it. Asset space: 1/N leads at 0.71, duration matching trails at 0.26. Surplus space: duration matching sits second at 2.15% volatility, 1/N fifth at 6.96%, all-equities last at 17.71%.
- 回撤的差距是 24 倍。funding ratio 最大回撤:久期匹配 −2.4%、盈余最优化 −3.6%、风险平价 −15.8%、1/N −24.4%、60/40 −39.9%、纯股 −58.9%。而同一个久期匹配组合的资产端回撤是 −30.1%——资产跌三成,盈余只跌 2.4%。 The drawdown spread is 24-fold. Maximum drawdown of the funding ratio: duration matching −2.4%, surplus-optimised −3.6%, risk parity −15.8%, 1/N −24.4%, 60/40 −39.9%, all-equities −58.9%. The same duration-matched portfolio's asset drawdown is −30.1% — the assets fell thirty per cent while the surplus fell 2.4%.
- 什么时候可以加风险,是一道可以算的题。funding ratio 100% 时,即使一股股票都不拿,一年内跌破 100% 的历史概率仍有 5%;到 115% 时,在同样 5% 的容忍度下可以持有 55% 股票;130% 时可以到 80%。风险预算不是偏好,是 funding ratio 的函数。 How much risk you can take is a computable question. At a funding ratio of 100%, even a pure duration-matched book has a 5% historical chance of falling below 100% within a year. At 115% the same 5% tolerance permits 55% equities; at 130%, 80%. The risk budget is not a preference — it is a function of the funding ratio.
摘要本文检验一个问题:当投资者背后有一笔负债时,「资产配置」应当怎么改。样本是 1993-02 至 2025-09 共 392 个月的美国月度数据,与站上其他研究笔记共用同一份公开数据管线(标普 500 全收益、美国国债收益率曲线合成的三条债券腿、LBMA 金价、世界银行商品价格指数)。负债被建模为一笔 20 年期定额年金,按当月 10 年期美国国债收益率平折现,采用恒定到期假设,修正久期样本均值 9.00 年。七个组合从 funding ratio 100% 出发,覆盖纯股、60/40、1/N 等权、风险平价、久期匹配、匹配+成长与盈余最优化。结论分三层:机制上,久期缺口与盈余波动是一条 U 形曲线,最低点在资产久期等于负债久期处;排序上,资产端与盈余端的表现排序几乎不相关,资产端第一的组合在盈余端只排第五;操作上,可承受的风险随 funding ratio 上升而系统性放宽,并且在 funding ratio 100% 时没有任何组合能同时做到「不跌破」与「拿高股票权重」。边界负债是合成的、单一利率折现、不含新业务与退保选择权;资产端只有六条腿、只做多、不加杠杆;全部为美国资产;含交易成本,不含税费与汇率。
AbstractThis note asks a narrow question: if the investor stands behind a liability, what should change in asset allocation? The sample is 392 monthly US observations from February 1993 to September 2025, sharing the same public data pipeline as the other notes on this site (S&P 500 total return, three bond legs synthesised from the Treasury yield curve, the LBMA gold fix, World Bank commodity indices). The liability is modelled as a 20-year level annuity, discounted flat at that month's 10-year Treasury yield under a constant-maturity assumption, with a sample-average modified duration of 9.00 years. Seven portfolios start from a funding ratio of 100%: all-equities, 60/40, 1/N, risk parity, duration matched, duration-matched plus growth, and surplus-optimised. The findings have three layers. Mechanically, the duration gap and surplus volatility trace a U whose minimum sits where asset duration equals liability duration. In ranking, asset-space and surplus-space performance are nearly uncorrelated — the best asset-only portfolio ranks fifth on surplus. Operationally, the tolerable amount of risk rises systematically with the funding ratio, and at a funding ratio of 100% no portfolio can simultaneously avoid a shortfall and carry a large equity weight. Limits: the liability is synthetic, discounted off a single yield, with no new business or policyholder options; the asset menu is six legs, long-only and unlevered; everything is US; costs are included, taxes and FX are not.
关键词 负债驱动投资 · funding ratio · 久期缺口 · 盈余最优化 · 免疫 · 风险预算Keywords liability-driven investment · funding ratio · duration gap · surplus optimisation · immunisation · risk budget
01负债是一个会动的分母The liability is a moving denominator
资产配置的教科书流程是:估一份资产的预期收益与协方差,解一个最优化问题,最大化风险调整后的收益。这个流程里没有「谁的钱」这个问题——组合是自成一体的,涨得多就是好。
The textbook allocation process estimates asset returns and a covariance matrix, solves an optimisation, and maximises risk-adjusted return. Nowhere in it does the question "whose money is this" appear — the portfolio stands alone, and more is better.
保险公司与养老金的处境不一样。它们手上的资产对应着一笔确定的、以本币计价的未来支付:保单到期要赔、养老金按月要发。这笔支付流有一个现值,叫做负债;资产除以负债叫做 funding ratio(偿付能力比率)。真正要管的不是资产本身,是这两者之差。
Insurers and pension funds are different. Their assets stand behind a contractual stream of future payments in domestic currency: claims at maturity, monthly benefits. That stream has a present value — the liability — and assets divided by it is the funding ratio. What has to be managed is not the assets but the difference between the two.
这个区别的第一层含义,就足以推翻很多直觉:负债不是常数。它的现值随利率反向变动,变动的幅度由久期决定。本文把负债建模为一笔 20 年期定额年金,按当月的 10 年期美国国债收益率平折现。下图把它拆开:左图是利率与年金现值因子的关系,右两幅是样本内负债现值与修正久期的实际路径。
The first implication of that difference is enough to overturn several intuitions: the liability is not a constant. Its present value moves inversely with rates, and the size of the move is set by duration. Here the liability is a 20-year level annuity discounted flat at that month's 10-year Treasury yield. The figure below opens it up: the left panel maps yield to annuity factor; the right two panels show the actual path of liability value and modified duration through the sample.
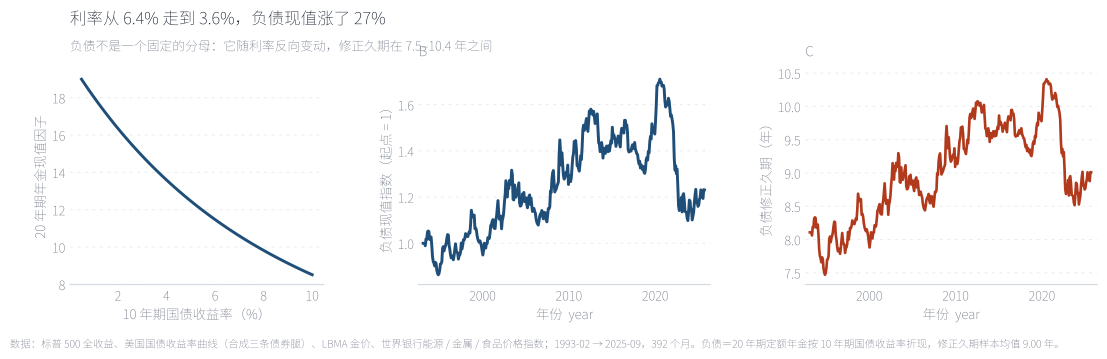
左图的斜率就是久期:收益率从 8% 降到 2%,同一个支付流的现值因子从 9.8 涨到 16.4。这意味着一个不做负债管理的组合,必须在资产端至少赚到这条曲线的涨幅,才能维持 funding ratio。中图是样本内实际发生的事——1993 年到 2020 年利率一路下行,负债现值涨了约 27%(右端回落是 2022 年之后的加息)。右图是修正久期:它不是一个可以一次定死的数,随着利率下行从 7.9 年慢慢爬到 9.9 年又回落。「久期匹配」是一个每个月都要重做的动作,不是一个可以买一次的产品。
The slope of the left panel is duration: as the yield falls from 8% to 2%, the same payment stream's present value factor climbs from 9.8 to 16.4. A portfolio that ignores the liability must earn at least that climb in assets just to hold its funding ratio. The middle panel is what actually happened — rates fell almost continuously from 1993 to 2020 and the liability value rose about 27%, with the pullback at the right end coming from the post-2022 hikes. The right panel is modified duration, which is not a number you set once: it drifted from 7.9 years up to 9.9 and back down. Duration matching is a monthly task, not a product you buy once.
来源:本文回测;负债=20 年期定额年金按当月 10 年期美国国债收益率平折现;面板 B 以 1993-02 的负债现值为 1。Source: author's backtest. The liability is a 20-year level annuity discounted flat at that month's 10-year Treasury yield; panel B indexes to the February 1993 liability value.
所以本文要回答的是三件事:(一)把目标从资产换成盈余,组合的排序会怎么变?(二)如果会变,变的是哪一项指标——收益、波动,还是回撤?(三)给定当前 funding ratio,能拿多少风险是算得出来的吗?
Three questions follow. One: if the objective moves from assets to surplus, how does the ranking change? Two: if it changes, which statistic changes — return, volatility, or drawdown? Three: given today's funding ratio, is the tolerable amount of risk computable?
02数据与方法Data and method
样本与站上其他研究笔记共用同一份公开数据管线:6 条资产腿——股票(标普 500 全收益)、长债(30 年期国债收益率合成,久期 15)、中债(10 年期,久期 7.5)、短债(2 年期,久期 1.9)、黄金(LBMA 伦敦金价)、商品(世界银行能源 / 金属 / 食品价格指数的等权合成)。数据从 1990-02 到 2025-09,前 36 个月用来做第一次估计,样本外从 1993-02 开始,共 392 个月(32.7 年)。原 8 条腿里的三条商品腿在这里合成一条,好让讨论集中在久期上。
The sample shares the public data pipeline used by the other notes: six asset legs — equities (S&P 500 total return), long bonds (synthesised from the 30-year Treasury yield, duration 15), 10-year bonds (duration 7.5), 2-year bonds (duration 1.9), gold (LBMA fix) and commodities (an equal-weighted composite of the World Bank energy, metals and food indices). The data run from February 1990 to September 2025, with the first 36 months used for the initial estimate, so the out-of-sample record starts in February 1993 and runs 392 months, 32.7 years. The three commodity legs of the eight-leg universe are merged into one here, to keep the discussion on duration.
负债的构造是全文最要紧的一段,所以单独写清楚:一笔恒定到期的 20 年期定额年金,按当月的 10 年期国债收益率平折现,修正久期用麦考利久期除以 1+y 得到——这一步必须做,否则和资产端债券腿的口径对不上(站上债券腿的月度收益是「票息 − 久期 × Δy」,那个久期就是修正久期)。
The liability construction is the load-bearing paragraph of this note, so it gets its own: a constant-maturity 20-year level annuity, discounted flat at that month's 10-year Treasury yield, with modified duration computed as Macaulay duration divided by one plus the yield. That last step is not optional — without it the liability is not on the same footing as the bond legs, whose monthly return is "carry − duration × Δy" with that duration being a modified one.
| 项目Item | 口径Definition | 说明Note | 修正久期Mod. duration |
|---|---|---|---|
| 负债Liability | 20 年期定额年金(每年支付 1 个单位),按当月 10 年期美国国债收益率平折现A 20-year level annuity (1 unit a year), discounted flat at that month's 10-year US Treasury yield | 恒定到期:每年新业务补上滚出的部分,久期不随时间缩短Constant maturity: new business replaces what rolls off, so duration does not shorten | 9.00 |
| 股票Equities | Yahoo Finance ^SP500TR 月度全收益Yahoo Finance ^SP500TR monthly total return | 月度总收益,含成本 2 个基点(单边)Monthly total return, charged 2 bps one way | 0.0 |
| 长债Long bonds | 美国财政部 30 年期国债收益率(久期 15)US Treasury 30-year yield, synthesised (duration 15) | 月度总收益,含成本 2 个基点(单边)Monthly total return, charged 2 bps one way | 15.0 |
| 中债10-year bonds | 美国财政部 10 年期国债收益率(久期 7.5)US Treasury 10-year yield, synthesised (duration 7.5) | 月度总收益,含成本 2 个基点(单边)Monthly total return, charged 2 bps one way | 7.5 |
| 短债2-year bonds | 美国财政部 2 年期国债收益率(久期 1.9)US Treasury 2-year yield, synthesised (duration 1.9) | 月度总收益,含成本 1 个基点(单边)Monthly total return, charged 1 bps one way | 1.9 |
| 黄金Gold | LBMA 伦敦金价月序列LBMA London gold monthly fix | 月度总收益,含成本 3 个基点(单边)Monthly total return, charged 3 bps one way | 0.0 |
| 商品Commodities | 世界银行能源 / 金属 / 食品价格指数等权合成World Bank energy / metals / food indices, equal-weighted composite | 月度总收益,含成本 5 个基点(单边)Monthly total return, charged 5 bps one way | 0.0 |
资产端有七个组合,覆盖从「完全不管负债」到「完全按负债优化」:
Seven portfolios sit on the asset side, spanning from "ignore the liability entirely" to "optimise straight through it":
| 组合Portfolio | 定义Definition | 资产久期Asset duration | 股票Equities | 长债Long bonds | 中债10-year bonds | 短债2-year bonds | 黄金Gold | 商品Commodities |
|---|---|---|---|---|---|---|---|---|
| 纯股All equity | 100% 股票,不做任何负债管理100% equities, no liability management at all | 0.00 | 100.0 | 0.0 | 0.0 | 0.0 | 0.0 | 0.0 |
| 60/4060/40 | 股票 60% + 中债 40%,机构最常见的默认基准60% equities + 40% 10-year bonds, the default institutional benchmark | 3.00 | 60.0 | 0.0 | 40.0 | 0.0 | 0.0 | 0.0 |
| 1/N 等权1/N equal weight | 六条腿各 1/6,不估任何参数One sixth in each leg, no parameters estimated | 4.07 | 16.7 | 16.7 | 16.7 | 16.7 | 16.7 | 16.7 |
| 风险平价Risk parity, ERC | 等风险贡献,每年 1 月用最近 36 个月协方差重解Equal risk contribution, re-solved each January on the trailing 36 months | 3.26 | 7.4 | 9.3 | 11.3 | 53.2 | 8.5 | 10.1 |
| 匹配 + 成长Duration match + growth | 久期匹配组合 60% + 股票 40%60% duration-matched sleeve + 40% equities | 5.40 | 40.0 | 32.5 | 0.0 | 27.5 | 0.0 | 0.0 |
| 久期匹配Duration matched | 只用长债与短债,逐月把资产久期对准负债久期Long and short bonds only, held so that asset duration tracks liability duration | 9.00 | 0.0 | 54.2 | 0.0 | 45.8 | 0.0 | 0.0 |
| 盈余最优化Surplus optimised | 盈余最优化:每年 1 月最大化 (盈余收益 − 现金) ÷ 盈余波动Surplus optimisation: each January, maximise (surplus return − cash) ÷ surplus volatility | 7.22 | 2.0 | 3.2 | 89.6 | 1.5 | 2.2 | 1.7 |
需要说明三个口径。第一,久期匹配不是固定权重:它每个月重算一次,只用长债与短债两腿,把资产久期对准当月的负债久期,所以它的长债权重会在 50%–60% 之间移动。第二,盈余最优化用的是「资产收益减负债收益」后的切点组合,每年 1 月用最近 36 个月重解一次,只做多、权重和为 1。第三,所有组合都从 funding ratio 100% 出发,并像站上其他笔记一样扣掉 1–5 个基点的单边成本。
Three conventions need stating. First, duration matching is not a fixed weight: it is recomputed monthly using only long and short bonds, targeting that month's liability duration, so its long-bond weight moves between roughly 50% and 60%. Second, surplus optimisation uses the tangency portfolio on "asset return minus liability return", re-solved each January on the trailing 36 months, long-only with weights summing to one. Third, every portfolio starts from a funding ratio of 100%, and all of them pay one to five basis points per leg, one way, as elsewhere on this site.
03机制:久期缺口就是盈余风险The mechanism: the duration gap is the surplus risk
把资产和负债放到同一把尺子上,只需要一个定义:盈余收益 s 满足 (1+s) = (1+r资产) ÷ (1+r负债)。当 r 都是小量时,它近似等于两者之差。
Putting assets and liabilities on one ruler takes a single definition: the surplus return s satisfies (1+s) = (1+rasset) ÷ (1+rliability), which for small r is approximately the difference between the two.
现在假设利率瞬时变动 Δy。资产端动 −DA·Δy,负债端动 −DL·Δy,于是盈余动 −(DA − DL)·Δy。也就是说:盈余的风险不来自资产波动,来自两边久期之差。久期缺口是 9 年,利率动 1 个百分点,funding ratio 就动 9%。
Now let rates move by Δy. The asset side moves −DA·Δy, the liability −DL·Δy, so the surplus moves −(DA − DL)·Δy. In other words: surplus risk does not come from asset volatility; it comes from the difference between the two durations. A nine-year gap means a one-point rate move moves the funding ratio nine per cent.
把这条关系画出来,是一条 U 形线。下面这个实验只做一件事:只用长债与短债两腿,把资产久期从 0 年一点一点调到 15 年,其他什么都不变。
Drawn out, that relationship is a U. The experiment below does one thing only: using just long and short bonds, walk asset duration from zero up to fifteen years, changing nothing else.
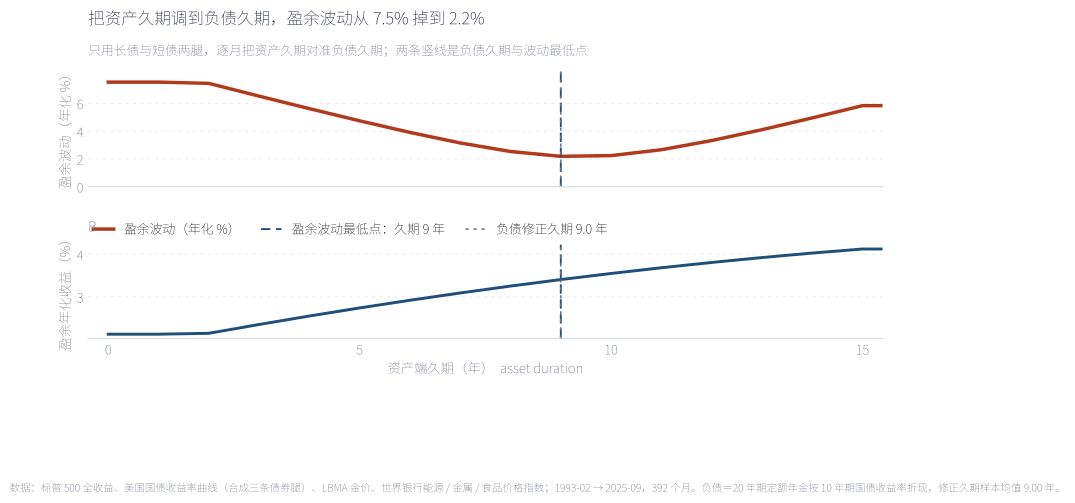
上面板是盈余波动:资产久期 0 年时 7.54%,逐年往上走,到 9 年降到 2.19%——正好是负债的修正久期。再往上加久期,波动重新上升(15 年时 5.84%),因为这时候是资产比负债更敏感。这条曲线的最低点不是一个巧合,它就是「免疫」的定义。下面板是盈余年化收益:它随资产久期单调上升(2.12% → 4.12%),因为长债在样本里承担了期限溢价。上下两幅合起来才是全貌:把久期调准,是用 2 个百分点的盈余收益,换掉 5.4 个百分点的盈余波动。
The upper panel is surplus volatility: 7.54% at zero asset duration, falling to 2.19% at nine years — precisely the liability's modified duration. Beyond that it rises again (5.84% at fifteen), because the assets have become more rate-sensitive than the liability. The minimum of that curve is not a coincidence; it is the definition of immunisation. The lower panel is surplus return, which rises monotonically with asset duration (2.12% to 4.12%) because long bonds carried a term premium in this sample. Read together: matching duration trades about two points of surplus return for five and a half points of surplus volatility.
来源:本文回测;逐月只用长债与短债把资产久期对准目标久期,392 个月,含成本;两条竖线是负债修正久期与盈余波动最低点。Source: author's backtest. Monthly long/short-bond portfolios targeted at each duration, 392 months, after costs; the two vertical lines mark the liability's modified duration and the volatility minimum.
一个必须写下来的细节:这七个组合里,只有久期匹配和盈余最优化是「按负债设计」的——前者的缺口是 0,后者的缺口是 −1.65 年,因为盈余最优化选出来的权重平均压在 10 年期国债上(89.6%),而 10 年期国债的久期(7.5)略低于负债(9.0)。其余五个组合的久期都是各自资产端逻辑的副产品,没有人替负债考虑过。
One detail has to be written down: only two of the seven are designed around the liability. Duration matching sits at a zero gap; surplus optimisation sits at −1.65 years because the optimiser put an average of 89.6% into 10-year bonds, whose duration of 7.5 falls a little short of the liability's 9.0. The other five portfolios have whatever duration their asset-side logic happened to produce, with nobody answering to the liability.
0432.7 年:七条 funding ratio 路径Thirty-two years: seven funding-ratio paths
现在把七个组合放进同一段历史,起点都是 funding ratio 100%。看两条线就够:一条是终点,一条是路径最差的时候跌到哪里。
Now run all seven through the same history, each starting from a funding ratio of 100%. Two things matter: where each ends up, and how far it fell on the way.
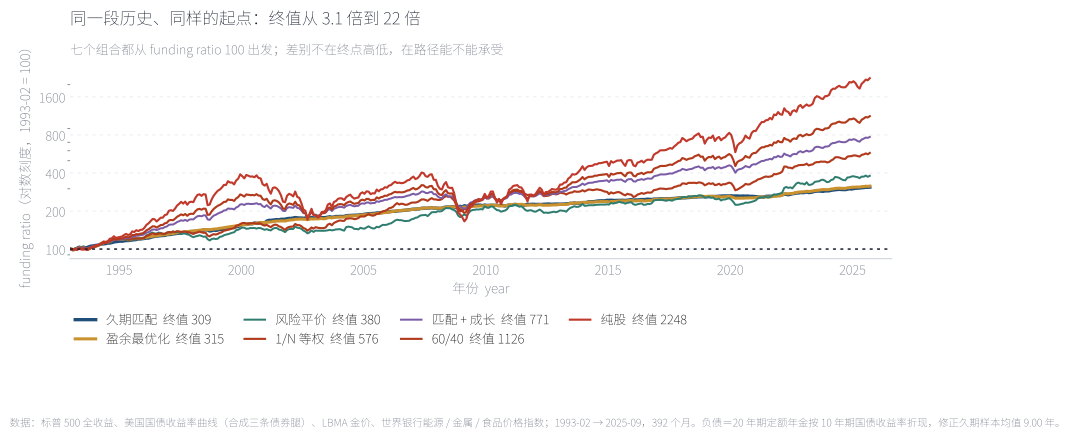
对数刻度下,最高的是纯股(终值 2248),最低的是久期匹配(311)——32.7 年里差了 7.2 倍。但这个差距不能直接读成「久期匹配很差」,因为两条线的路径完全不同:纯股的 funding ratio 在 2008 年从 190 掉到 108、在 2022 年又出现一次深度回撤;久期匹配那条线几乎是单调向上的。更重要的是,七条线的相对位置在三十年里换过好几次——2000 年之后久期匹配一度领先,2010 年之后被甩开,2022 年又追回来一段。
On a log scale the top line is all-equities (ending at 2248) and the bottom is duration matching (311) — a 7.2-fold spread over 32.7 years. But that gap cannot be read as "duration matching was bad", because the paths are entirely different in shape: the equity funding ratio fell from 190 to 108 through 2008 and drew down hard again in 2022, while the duration-matched line is almost monotone. More importantly, the relative positions change several times across the three decades — duration matching led at points after 2000, was left behind after 2010, and clawed some back in 2022.
来源:本文回测;七个组合均为月度再平衡、每年 1 月重解权重(久期匹配与盈余最优化),已扣 1–5 个基点的单边成本。Source: author's backtest. All seven rebalance monthly, with weights re-solved each January where applicable (duration matching and surplus optimisation), net of one to five basis points per leg.
| 组合Portfolio | 资产年化 %Return % | 资产波动 %Vol % | 资产夏普Sharpe | 资产回撤 %Max DD % | 盈余年化 %Surplus % | 盈余波动 %Surplus vol % | 盈余回撤 %FR DD % | FR 最低FR low |
|---|---|---|---|---|---|---|---|---|
| 纯股All equity | 10.80 | 14.8 | 0.60 | -50.9 | 10.00 | 17.71 | -58.9 | 98.3 |
| 60/4060/40 | 8.48 | 9.1 | 0.67 | -29.6 | 7.69 | 10.97 | -39.9 | 99.2 |
| 1/N 等权1/N equal weight | 6.28 | 5.3 | 0.71 | -15.2 | 5.51 | 6.96 | -24.4 | 98.5 |
| 风险平价Risk parity, ERC | 4.94 | 4.1 | 0.59 | -8.8 | 4.17 | 6.74 | -15.8 | 98.5 |
| 匹配 + 成长Duration match + growth | 7.23 | 7.1 | 0.67 | -22.1 | 6.45 | 7.48 | -26.8 | 98.6 |
| 久期匹配Duration matched | 4.27 | 7.7 | 0.26 | -30.1 | 3.51 | 2.15 | -2.4 | 98.8 |
| 盈余最优化Surplus optimised | 4.33 | 6.9 | 0.29 | -25.4 | 3.57 | 2.03 | -3.6 | 98.5 |
这张表里藏着全文的转折点。如果只看资产端,结论和站上其他笔记一样:1/N 等权的夏普 0.71 最高,久期匹配的 0.26 最低。但把视线移到右边四列,排序立刻不一样了——久期匹配的盈余波动是 2.15%(第二低),funding ratio 最大回撤是 −2.4%(最低);1/N 等权的盈余波动是 6.96%,盈余回撤 −24.4%。
The turning point of this note is inside this table. In asset space the answer matches the other notes on this site: 1/N leads on Sharpe at 0.71 and duration matching trails at 0.26. Move to the four right-hand columns and the ordering breaks: duration matching's surplus volatility is 2.15%, second lowest, and its maximum funding-ratio drawdown is −2.4%, the lowest. 1/N's surplus volatility is 6.96% and its surplus drawdown −24.4%.
还有一处值得单独指出:久期匹配的盈余年化只有 3.51%,比纯股的 10.00% 低 6.5 个百分点,但这是它自己选的——Exhibit 2 已经说明,久期越长盈余收益越高,久期匹配为了把波动压到最低,主动放弃了那部分期限溢价。这不是一个「跑不赢」的组合,而是一个明确定价的保险。
One more thing deserves its own sentence: duration matching earns 3.51% a year on surplus, 6.5 points below all-equities at 10.00% — but that was its choice. Exhibit 2 already showed that surplus return rises with duration, and duration matching gives up that term premium on purpose to minimise volatility. This is not a portfolio that failed to keep up; it is an explicitly priced insurance policy.
05换一个纵轴,排序就换了一遍Change the vertical axis and the ranking changes with it
把七个组合分别画在两张图上——左边是资产空间(横轴资产波动、纵轴资产年化),右边是盈余空间(横轴盈余波动、纵轴盈余年化)。同样的七个点,位置完全不同。
Plot the same seven portfolios in two spaces: on the left asset space (volatility against return), on the right surplus space (surplus volatility against surplus return). Same seven dots, completely different places.
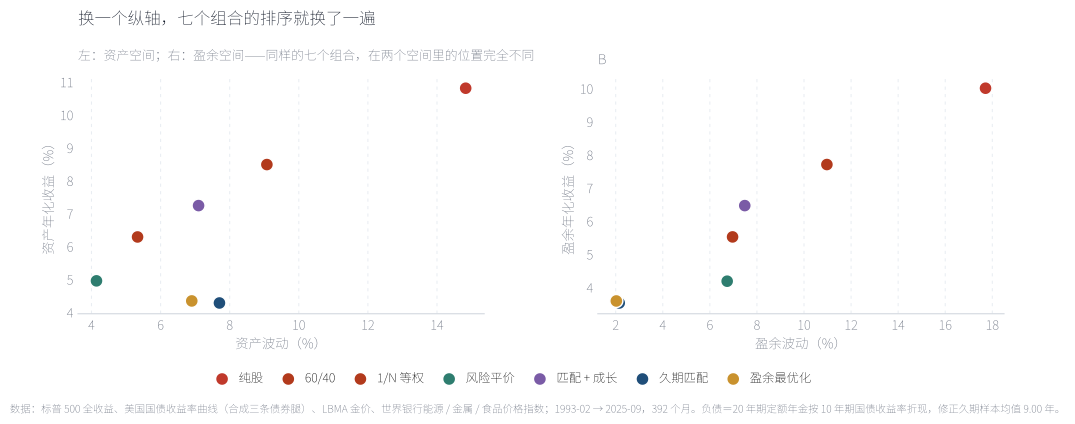
资产空间里,1/N 等权在左上角(波动 5.3%、年化 6.28%,夏普 0.71),久期匹配在右下区域(波动 7.7%、年化只有 4.27%,夏普 0.26)——它承担了比等权更多的波动,换到更少的收益。盈余空间里,两个点整片左移到波动 2% 一带:久期匹配 (2.15, 3.51) 与盈余最优化 (2.03, 3.57) 站在最左边,而 1/N 落在 (6.96, 5.51)、纯股落在 (17.71, 10.00)。用盈余夏普来排:匹配+成长 0.54 → 盈余最优化 0.52 → 60/40 0.51 → 纯股 0.49 → 久期匹配 0.47 → 1/N 0.45。1/N 从资产端的第一名掉到盈余端的第六名。
In asset space, 1/N sits in the top-left (5.3% volatility, 6.28% return, a 0.71 Sharpe) while duration matching sits lower-right (7.7% volatility for only 4.27% return, a 0.26 Sharpe) — it took more volatility than equal weighting and received less return. In surplus space two dots slide all the way to the left edge: duration matching at (2.15, 3.51) and surplus optimisation at (2.03, 3.57), while 1/N lands at (6.96, 5.51) and all-equities at (17.71, 10.00). Ranked by surplus Sharpe: duration-match-plus-growth 0.54, surplus-optimised 0.52, 60/40 0.51, all-equities 0.49, duration matching 0.47, 1/N 0.45. The best asset-only portfolio is sixth on surplus.
来源:本文回测;盈余波动与盈余年化为 392 个月年化口径;盈余夏普=(盈余年化 − 年化现金) ÷ 盈余波动。Source: author's backtest. Surplus volatility and return are annualised over 392 months; surplus Sharpe = (surplus return − annualised cash) ÷ surplus volatility.
把这张图拆成一句话:资产空间衡量的「效率」,是每单位资产波动换来多少资产收益;盈余空间衡量的,是每单位盈余波动换来多少盈余收益。这两件事在数学上不等价,因为负债本身也在动。而负债的波动是负相关的——利率下行使负债上升,同时使长债上涨——所以一个在资产端看起来很「保守」的组合(久期匹配,资产端夏普 0.26),在盈余端可以很有效率。
Compressed into one sentence: asset space measures how much asset return each unit of asset volatility buys; surplus space measures how much surplus return each unit of surplus volatility buys. These are not equivalent, because the liability moves too. And the liability is negatively correlated with the thing that hedges it — falling rates raise the liability and lift long bonds at the same time — so a portfolio that looks conservative on the asset side (duration matching, asset Sharpe 0.26) can be highly efficient on the surplus side.
06资产跌三成,盈余只跌 2.4%Assets fell 30%; the surplus fell 2.4%
上一节用的是波动,这一节换一个更贴近决策的指标:最大回撤。资产端的最大回撤和 funding ratio 的最大回撤,是两个几乎不相关的数字。
The last section used volatility; this one uses the statistic that actually drives decisions: maximum drawdown. An asset-side drawdown and a funding-ratio drawdown are two nearly unrelated numbers.
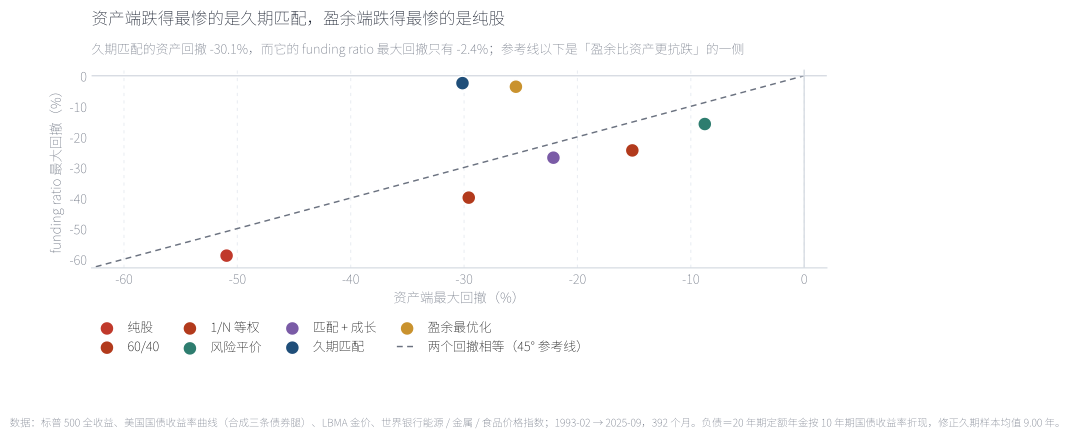
横轴是资产端最大回撤,纵轴是 funding ratio 最大回撤,虚线是两个回撤相等的参考线。久期匹配落在最左边且最靠上:资产端跌了 30.1%,funding ratio 只跌了 2.4%——接近九个百分点的差距,全部由负债同期下跌(利率上行)抵消。它的下方是盈余最优化(资产 −25.4%、盈余 −3.6%)。另一头,纯股是资产 −50.9%、盈余 −58.9%——盈余比资产跌得还多,因为它在股票下跌的同时还背着一个没有被对冲的久期缺口。七个点里有六个落在参考线附近,只有久期匹配与盈余最优化明显在线上方。
The horizontal axis is the asset drawdown, the vertical is the funding-ratio drawdown, and the dashed line marks where the two are equal. Duration matching sits furthest left and highest: assets fell 30.1% while the funding ratio fell just 2.4% — a gap of nearly nine points, all of it offset by the liability falling over the same window as rates rose. Just below it is surplus optimisation (−25.4% on assets, −3.6% on surplus). At the other end, all-equities went −50.9% on assets and −58.9% on surplus — a worse drawdown in surplus than in assets, because it carried an unhedged duration gap while the equity market fell. Six of the seven dots sit near the reference line; only duration matching and surplus optimisation are clearly above it.
来源:本文回测;资产端最大回撤按累计净值口径、funding ratio 最大回撤按 funding ratio 序列口径,均为 392 个月月度数据。Source: author's backtest. Asset drawdown is measured on the cumulative value index and funding-ratio drawdown on the funding-ratio series, both monthly over 392 months.
为什么会这样?因为久期匹配手里只有长债与短债,而长债在 2021-2023 那段加息里跌了将近一半——资产端它当然是差生。但同一段时间负债也跌了,而且久期缺口是零,两边等量下跌,funding ratio 几乎不动。这就是「资产端跌得难看、盈余端却没事」的完整解释:不是资产没有风险,是这份风险与负债的风险方向一致、数量相同。
Why does this happen? Because duration matching holds only long and short bonds, and long bonds lost nearly half their value through the 2021–2023 hiking cycle — on the asset side it is plainly the worst pupil. Over the same window, though, the liability fell too, and with a zero duration gap the two declines cancel almost exactly, leaving the funding ratio intact. That is the full explanation of "ugly on assets, untouched on surplus": the risk is not absent, it is the same risk, in the same direction, in the same size, as the liability's.
07利率动一下,谁的 funding ratio 会动When rates move, whose funding ratio moves
久期缺口是抽象的,把它翻译成投资委员会的语言就是一张情景表:利率动 1 个百分点,我的偿付能力会变成什么样。下表是两边都按修正久期的一阶近似算出来的瞬时冲击,久期匹配那一行是 0。
A duration gap is abstract; translated into the language of an investment committee it becomes a scenario table: if rates move a point, what happens to my funding position? The table below applies the first-order duration approximation on both sides instantaneously; the duration-matched row is zero.
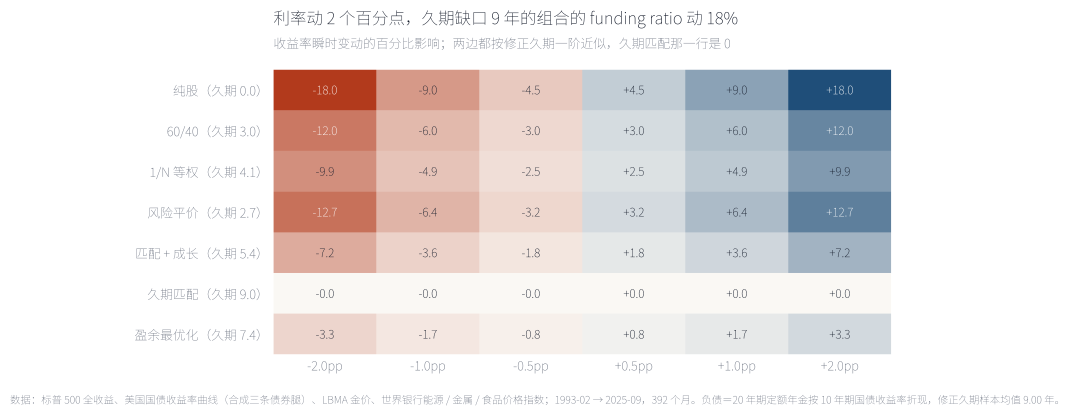
纯股组合的久期是 0、负债是 9 年,缺口 −9.01 年:利率下行 2 个百分点,funding ratio 掉 18.0%;上行 2 个百分点,涨 18.0%。60/40 的缺口是 −6.01 年(中债久期 7.5 帮它买回三个点),风险平价 −6.35 年,1/N 等权 −4.94 年(六条腿里三条债券的久期被四条零久期腿摊薄),匹配+成长 −3.60 年。久期匹配是 0.00 年,一整行都是 0.0;盈余最优化是 −1.65 年,最坏 ±3.3%。
All-equities has zero duration against a nine-year liability, a gap of −9.01 years: rates down two points takes the funding ratio down 18.0% and up two points takes it up 18.0%. The 60/40 sits at −6.01 (its 10-year bond leg buys back about three points), risk parity at −6.35, 1/N at −4.94 (three bond legs diluted by four zero-duration ones) and duration-match-plus-growth at −3.60. Duration matching reads 0.00, with an entire row of 0.0; surplus optimisation reads −1.65, worst case ±3.3%.
来源:本文回测;用最后一个月的权重与负债久期,两边都按「−修正久期 × Δy」重估,凸性两边同样略去,久期匹配那一行因此是 0。Source: author's backtest. Using the final month's weights and liability duration, both sides revalued as "−modified duration × Δy" with convexity omitted on both, which is why the duration-matched row is exactly zero.
| 组合Portfolio | 资产久期Asset duration | 久期缺口Duration gap | 利率 -2.0ppRates -2.0pp | 利率 -1.0ppRates -1.0pp | 利率 -0.5ppRates -0.5pp | 利率 +0.5ppRates +0.5pp | 利率 +1.0ppRates +1.0pp | 利率 +2.0ppRates +2.0pp |
|---|---|---|---|---|---|---|---|---|
| 纯股All equity | 0.00 | -9.01 | -18.0 | -9.0 | -4.5 | +4.5 | +9.0 | +18.0 |
| 60/4060/40 | 3.00 | -6.01 | -12.0 | -6.0 | -3.0 | +3.0 | +6.0 | +12.0 |
| 1/N 等权1/N equal weight | 4.07 | -4.94 | -9.9 | -4.9 | -2.5 | +2.5 | +4.9 | +9.9 |
| 风险平价Risk parity, ERC | 2.66 | -6.35 | -12.7 | -6.4 | -3.2 | +3.2 | +6.4 | +12.7 |
| 匹配 + 成长Duration match + growth | 5.41 | -3.60 | -7.2 | -3.6 | -1.8 | +1.8 | +3.6 | +7.2 |
| 久期匹配Duration matched | 9.01 | -0.00 | -0.0 | -0.0 | -0.0 | +0.0 | +0.0 | +0.0 |
| 盈余最优化Surplus optimised | 7.35 | -1.65 | -3.3 | -1.7 | -0.8 | +0.8 | +1.7 | +3.3 |
这张表最实用的地方在于它是可以反过来用的:如果一家保险公司的偿付能力预算是「利率冲击下 funding ratio 波动不超过 5%」,那么把缺口控制在 5 年以内就能满足;「不超过 3%」对应 3 年以内。久期缺口是一个可以直接写进风险限额的数字,而资产端波动率不能。
What makes this table useful is that it runs backwards: if an insurer's solvency budget is "funding-ratio impact under a rate shock no worse than 5%", then a gap inside five years satisfies it; 3% corresponds to three years. A duration gap is a number that can be written directly into a risk limit; asset volatility cannot.
08什么时候可以加风险When you are allowed to take more risk
前面几节说的是「久期应该调准」,但没有回答另一个问题:调准之后,剩下的风险预算应该放多少到股票上?这不是偏好问题,它可以算:给定起始 funding ratio,找出让「一年内跌破 100%」的历史概率落在容忍度以内的最大股票权重。
The earlier sections say the duration should be matched; they do not answer the next question: once it is matched, how much of the remaining risk budget belongs in equities? That is not a matter of taste — it can be computed. Given a starting funding ratio, find the largest equity weight whose historical one-year probability of falling below 100% stays inside tolerance.
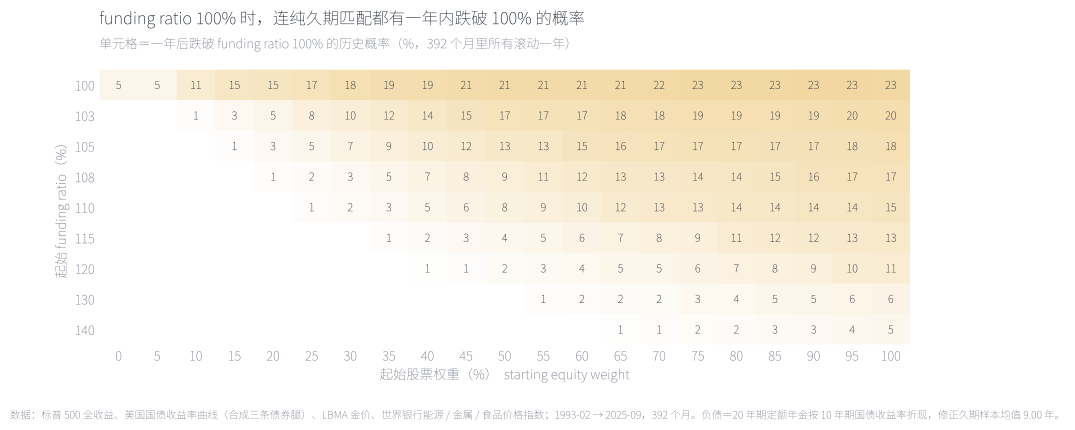
横轴是起始股票权重(其余放在久期匹配组合里),纵轴是起始 funding ratio,单元格是一年后跌破 100% 的历史概率。读法是从左往右、从上往下:第一行(funding ratio 100%)里,即使一股股票都不拿,概率也有 5%——因为久期匹配的盈余波动是 2.15%、盈余年化只有 3.51%,一年之内走负并不罕见。往上走到 115% 那一行,同样 5% 的容忍度允许持有 55% 股票;130% 允许 80%;140% 允许 100%。风险预算随 funding ratio 上升而放宽,是这条热力图最直接的读法。
The horizontal axis is the starting equity weight (the rest sits in the duration-matched sleeve), the vertical is the starting funding ratio, and each cell is the historical probability of falling below 100% after one year. Read left to right and top to bottom: in the first row, at a funding ratio of 100%, even with no equities at all the probability is 5% — because the duration-matched sleeve runs 2.15% surplus volatility against 3.51% surplus return, and a negative year is not rare. Move up to 115% and the same 5% tolerance permits 55% equities; at 130%, 80%; at 140%, 100%. The risk budget widening with the funding ratio is the most direct reading of this chart.
来源:本文回测;概率=392 个月里所有滚动一年窗口的经验频率;股票权重之外的资金全部放在久期匹配组合里。Source: author's backtest. Probabilities are empirical frequencies across every rolling one-year window in the 392 months; all capital outside the equity weight sits in the duration-matched sleeve.
| 起始 funding ratioStarting funding ratio | 一年跌破 100% 的概率 ≤ 1%P(one-year shortfall) ≤ 1% | 一年跌破 100% 的概率 ≤ 5%P(one-year shortfall) ≤ 5% | 一年跌破 100% 的概率 ≤ 10%P(one-year shortfall) ≤ 10% |
|---|---|---|---|
| 100% | 0% | 0% | 5% |
| 103% | 10% | 15% | 30% |
| 105% | 10% | 25% | 35% |
| 108% | 20% | 35% | 50% |
| 110% | 20% | 40% | 60% |
| 115% | 30% | 55% | 75% |
| 120% | 40% | 65% | 90% |
| 130% | 55% | 80% | 100% |
| 140% | 65% | 100% | 100% |
三档容忍度给出三条完全不同的曲线,而它们的方向一致:容忍度高一点、funding ratio 富余一点,就可以多拿风险。100% 那一行三档都只能给 0–5% 的股票权重——这是一个很反直觉但很实际的结论:刚好够付的机构,在数学上几乎没有资格承担股票风险。而要等到 funding ratio 上到 130% 以上,股票权重才变得自由。
Three tolerances produce three different curves pointing the same way: tolerate a little more shortfall risk, or hold a little more surplus, and you can carry more equity. In the 100% row all three allow only 0–5% equities — a counter-intuitive but practical result: an institution that is exactly fully funded has, mathematically, almost no licence to own equity risk. Equity weights only become free once the funding ratio is above roughly 130%.
09同一段历史,五种利率环境One history, five rate environments
全样本的平均值会掩盖一件重要的事:这些组合的相对表现高度取决于利率往哪个方向走。把 32.7 年按 10 年期收益率的走势切成五段,看每段里 funding ratio 累计变化了多少。
Full-sample averages hide something important: the relative performance of these portfolios depends heavily on which way rates went. Cut the 32.7 years into five stretches by the path of the 10-year yield, and track how each funding ratio moved.
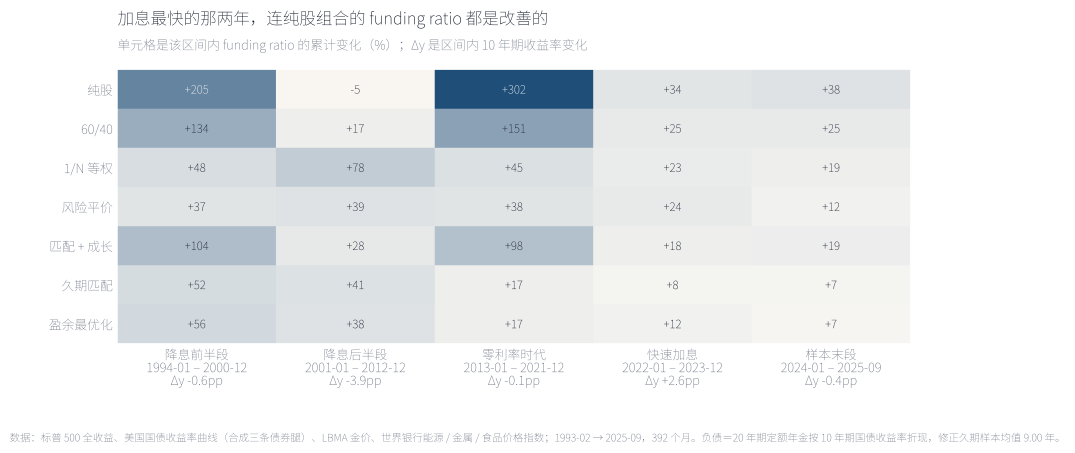
三个可以直接读出来的结论。第一,降息后半段(2001-2012,收益率下行 3.90 个百分点)是负债最难受的十二年:负债现值的涨幅吃掉了资产收益,纯股的 funding ratio 是 −5.1%,而久期匹配是 +42.2%、1/N 等权 +78.1%。第二,2022 年之后的快速加息(+2.62 个百分点)里,七个组合的 funding ratio 全部改善——连纯股都 +33.9%——因为负债跌得比股票还多。这是很多人没有意识到的一面:对一家负债驱动机构,加息不是坏事。第三,零利率时代(2013-2021)久期匹配只涨了 17.5%,同一段纯股涨了 302.0%,说明久期匹配放弃的期限溢价在低利率环境里特别昂贵。
Three readings follow. First, the second easing leg (2001–2012, yields down 3.90 points) was the worst twelve years for a liability: the rise in liability value ate the asset returns, leaving all-equities at −5.1% while duration matching made +42.2% and 1/N +78.1%. Second, in the fast hiking of 2022 onward (+2.62 points) every one of the seven improved its funding ratio — even all-equities, at +33.9% — because the liability fell further than equities did. This is a side most people miss: for a liability-driven institution, rate hikes are not bad news. Third, through the zero-rate era (2013–2021) duration matching gained only 17.5% while all-equities gained 302.0%, showing how expensive the foregone term premium becomes when rates are pinned near zero.
来源:本文回测;单元格是该区间内 funding ratio 的累计变化(%),Δy 是区间内 10 年期收益率的变化;各区间长度不同(84 / 144 / 108 / 24 / 21 个月)。Source: author's backtest. Cells are the cumulative change in the funding ratio over each episode (%), Δy is the change in the 10-year yield; the episodes differ in length (84 / 144 / 108 / 24 / 21 months).
再换一把尺子:不看整段,看所有可能的滚动五年窗口(每个组合 333 个),把每个窗口的盈余年化收益画成区间。
Change the ruler once more: instead of whole episodes, look at every possible rolling five-year window (333 per portfolio) and plot each one's annualised surplus return as a range.
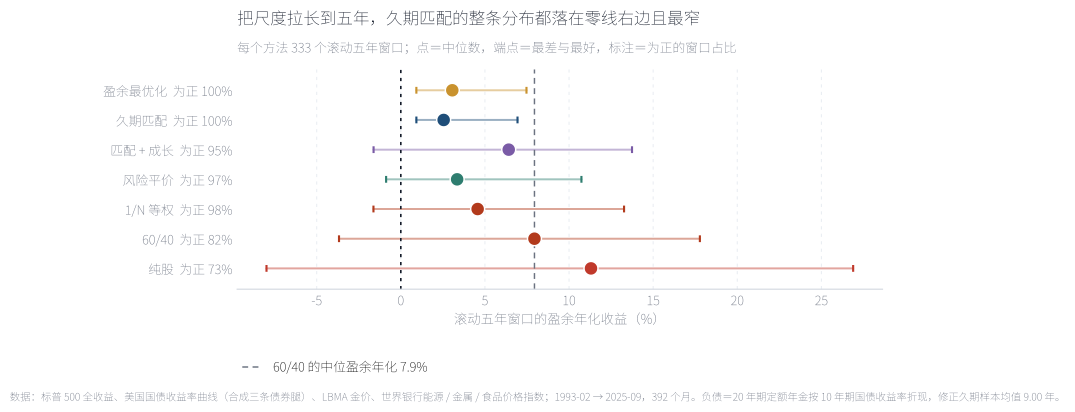
点是最常用的中位数,两端是最差与最好,行标注是「为正的窗口占比」。久期匹配与盈余最优化是 100% 为正,而且分布最窄(久期匹配从 +0.93% 到 +6.94%);纯股的中位数最高(+11.30%),但 27.3% 的窗口是负的,最差的一个五年是 −7.98%;60/40 有 18% 的窗口为负。换句话说:在资产端,「承担更多风险」在大多数五年窗口里确实换来更多收益;在盈余端,它换来的是一条更宽、会翻负的分布。
The dot is the median, the ends are the worst and best, and the row label is the share of windows that were positive. Duration matching and surplus optimisation were positive in 100% of windows and have the narrowest distributions (duration matching from +0.93% to +6.94%). All-equities has the highest median at +11.30% but 27.3% of its windows were negative, with a worst five years of −7.98%; the 60/40 was negative in 18%. In short: in asset space, taking more risk really did buy more return in most five-year windows; in surplus space, it bought a wider distribution that occasionally turns negative.
来源:本文回测;每个组合 333 个滚动五年窗口,纵轴为该窗口的盈余年化收益;虚线是 60/40 的中位数。Source: author's backtest. 333 rolling five-year windows per portfolio, showing each window's annualised surplus return; the dashed line is the 60/40's median.
10自己动手:拖动股票权重与久期目标Do it yourself: drag the equity weight and the duration target
最后一步留给你自己。下面这台旋钮有两个开关:股票权重(其余放进债券袖子)与久期目标(债券袖子把资产久期对准几年级别的负债)。两条线会实时重算:深色是盈余最优化与久期匹配所对应的「负债对齐」档,浅色是六条腿等权。把久期从 0 拖到 15,你会看到 funding ratio 的曲线从「抖」变成「直」,再从「直」变回「抖」。
The last step is yours. Two dials: the equity weight (the rest goes into the bond sleeve) and the duration target (the liability maturity the sleeve aims at). Two curves recompute live — a pale 1/N line and the dark line for the selected duration target. Drag the target from 0 to 15 and watch the funding-ratio path go from jagged to straight and back to jagged again.
三个位置值得先试。久期 0、股票 100%:这是「完全不管负债」的极端,盈余波动跳到 17.71%、FR 最大回撤 −58.9%。久期 9、股票 0%:固定目标下的久期匹配,盈余波动 2.19%、FR 最大回撤 −2.5%、一年跌破 100% 的概率 0.3%(正文表 4 那一行是逐月重解目标的版本,读数几乎相同:2.15% / −2.4%)。久期 9、股票 30%:这是本文实验里最像真实机构的一档——盈余波动 5.92%、FR 最大回撤 −20.1%、FR 终值 607;同样拿 30% 以上股票风险的 60/40 是 7.48% 与 −39.9%。注意久期拖到 15 时波动会重新上升(5.84%):这时候不是负债在动,是你在赌方向。
Three positions are worth trying first. Duration 0 with 100% equities: the "ignore the liability" extreme, at 17.71% surplus volatility and a −58.9% funding-ratio drawdown. Duration 9 with 0% equities: the duration match under a fixed target, at 2.19% surplus volatility, a −2.5% drawdown and a 0.3% one-year shortfall probability (the row in Table 4 re-solves the target monthly and reads almost identically, 2.15% and −2.4%). Duration 9 with 30% equities: closest to a real institution — 5.92% surplus volatility, a −20.1% drawdown and a terminal funding ratio of 607, against 7.48% and −39.9% for a 60/40 carrying the same equity risk. Note that volatility rises again as the target approaches 15 (5.84%): at that point the liability is no longer the thing moving — you are betting on direction.
来源:本文回测;股票权重之外的资金按目标久期分配到长债与短债两腿;「一年跌破 100%」为 392 个月里滚动一年窗口的经验频率;利率冲击按 −缺口 × Δy 计算。Source: author's backtest. Capital outside the equity weight is split between long and short bonds to hit the duration target; the one-year shortfall figure is the empirical frequency across rolling one-year windows; the rate-shock figure is −gap × Δy.
11结论:换分母,换排序,换风险预算Conclusion: a new denominator, a new ranking, a new risk budget
回到开头的三个问题。
Back to the three opening questions.
第一,排序确实会变,而且变得很彻底。资产端夏普排名前四的组合里,有三个在盈余端掉出前四;资产端垫底的久期匹配(0.26)在盈余端排第二低波动。用盈余夏普排,1/N 等权从第一掉到第六。这不是因为久期匹配变好了,而是因为衡量它的那把尺子换了——而换尺子恰恰是负债驱动投资的第一步。
First, the ranking does change, and thoroughly. Three of the top four asset-only portfolios drop out of the surplus top four, while duration matching — dead last on assets at 0.26 — sits second lowest on surplus volatility. Ranked by surplus Sharpe, 1/N falls from first to sixth. Not because duration matching improved, but because the ruler changed — and changing the ruler is precisely the first move in liability-driven investment.
第二,变的主要是回撤,其次才是波动。七个组合的资产端最大回撤跨 −8.8% 到 −50.9%(5.8 倍),盈余端跨 −2.4% 到 −58.9%(24 倍)。久期匹配的资产端回撤是 −30.1%,盈余端只有 −2.4%。同一份风险,在两张报表上的读数可以差一个数量级——这是本文最实用的一句话。
Second, what changes most is the drawdown, then the volatility. Asset drawdowns span −8.8% to −50.9% (a factor of 5.8); surplus drawdowns span −2.4% to −58.9% (a factor of 24). Duration matching drew down 30.1% in assets and 2.4% in surplus. The same risk can read an order of magnitude differently on the two statements — the most practical sentence in this note.
第三,风险预算算得出来,而且答案比直觉保守。funding ratio 100% 时,即使不持有任何股票,一年内跌破 100% 的历史概率仍有 5%;115% 时才允许 55% 的股票,130% 允许 80%。久期缺口是可以写进限额的数字,股票权重应该是 funding ratio 的函数,而不是投资委员会的偏好。
Third, the risk budget is computable, and the answer is more conservative than intuition. At a funding ratio of 100%, even with no equities at all the historical probability of falling short within a year is 5%; only at 115% does 55% equities fit inside that tolerance, and 80% needs 130%. A duration gap is a number you can write into a limit, and the equity weight should be a function of the funding ratio rather than a committee preference.
边界必须写清楚。第一,负债是合成的、单一利率平折现,真实的保险负债有分期限的贴现曲线、退保与续保选择权、以及新业务带来的久期漂移——本文的恒定到期假设是一个简化,它让负债变成一个干净的久期工具,也让结论更容易读,但不能替代真实的精算模型。第二,资产端只有六条腿、只做多、不加杠杆,没有利率互换、没有通胀挂钩债券——真实的负债驱动组合主要靠这两样工具做精细对冲。第三,全部为美国资产与美元负债,没有汇率维度。第四,全部为历史回测,含 1–5 个基点的单边交易成本,不含税费、融资成本与保证金。第五,「跌破 100% 的概率」是用 392 个月的经验频率估计的,样本内只包含了两个完整的加息周期,估计的尾部比真实情况乐观。
The boundaries need stating. One, the liability is synthetic and discounted off a single yield; a real insurance liability has a term structure of discount rates, lapse and renewal options, and duration drift from new business. The constant-maturity assumption is a simplification that turns the liability into a clean duration instrument and makes the results readable, but it is not a substitute for an actuarial model. Two, the asset menu is six legs, long-only and unlevered, with no interest-rate swaps and no inflation-linked bonds — the two tools a real liability-driven portfolio leans on most for fine hedging. Three, everything is US assets against a dollar liability, with no FX dimension. Four, these are historical backtests with one to five basis points per leg, excluding taxes, funding costs and margin. Five, the "probability of falling below 100%" is estimated from 392 monthly observations containing only two complete hiking cycles, so its tail is optimistic relative to reality.
English version
Question. Portfolio optimisation assumes the objective is asset growth. An insurer or a pension fund stands behind a contractual stream of payments in domestic currency; its present value is the liability, and assets divided by it is the funding ratio. What has to be managed is the difference. This note models the liability as a constant-maturity 20-year level annuity discounted flat at that month's 10-year US Treasury yield, with modified duration equal to Macaulay duration divided by one plus the yield. Over the sample the modified duration averages 9.00 years and drifts between 7.9 and 9.9, while the 10-year yield falls from 6.4% to 3.6% and lifts the liability's present value by 27%.
Data and seven portfolios. Six asset legs — equities, 30-year, 10-year and 2-year Treasuries, gold and a commodity composite — over 428 months from February 1990, with the first 36 used for the initial estimate, leaving 392 out-of-sample months (32.7 years) from February 1993. The seven portfolios are all-equities, 60/40, 1/N, risk parity, duration matched, duration-match-plus-growth, and surplus-optimised; each starts from a funding ratio of 100% and pays one to five basis points per leg.
Result 1 — the duration gap is the surplus risk. Surplus return satisfies (1+s) = (1+rasset) ÷ (1+rliability), so to first order the surplus moves by −(DA − DL)·Δy. Sweeping asset duration from zero to fifteen years with nothing else changed traces a U: surplus volatility reads 7.54% at zero duration, bottoms at 2.19% at nine years — the liability's modified duration — and rises to 5.84% at fifteen. Surplus return climbs monotonically across the same sweep, from 2.12% to 4.12%: matching duration trades about two points of return for five and a half points of volatility.
Result 2 — the ranking is rewritten. All-equities carries a −9.01 year gap, so a two-point rate fall costs its funding ratio 18.0%; duration matching carries a 0.00 gap and reads zero across the row. Over the full sample 1/N leads on asset Sharpe at 0.71 and duration matching trails at 0.26 — and in surplus space duration matching's volatility is 2.15% (second lowest) against 1/N's 6.96% (fifth). Ranked by surplus Sharpe: duration-match-plus-growth 0.54, surplus-optimised 0.52, 60/40 0.51, all-equities 0.49, duration matching 0.47, 1/N 0.45, risk parity 0.27. The best asset-only portfolio ranks sixth on surplus.
Result 3 — the drawdown spread is twenty-four-fold. Asset drawdowns span −8.8% to −50.9%, a factor of 5.8. Funding-ratio drawdowns span −2.4% for duration matching to −58.9% for all-equities, a factor of 24 — and all-equities' surplus drawdown is worse than its asset drawdown, because it carried an unhedged duration gap into the fall. Duration matching lost 30.1% on assets while its funding ratio lost 2.4%: same risk, same direction, same size as the liability's.
Result 4 — the risk budget is computable, and more conservative than intuition. At a funding ratio of 100%, even a pure duration-matched book has a 5% historical probability of falling below 100% within a year, so a 5% shortfall tolerance permits zero equities. At 115% the same tolerance permits 55%; at 130%, 80%; at 140%, 100%. Under a 1% tolerance, nothing above a 10% equity weight is available until the funding ratio passes 103%, and 65% is the ceiling at 140%.
Result 5 — the environment decides. In the second easing leg (2001–2012, yields down 3.90 points) the liability was the problem: all-equities' funding ratio fell 5.1% while duration matching gained 42.2% and 1/N 78.1%. In the fast hiking of 2022 onward (+2.62 points), all seven improved — even all-equities at +33.9% — because the liability fell further than equities did. Through the zero-rate era (2013–2021) duration matching gained only 17.5% against 302.0% for equities, showing how expensive the foregone term premium becomes when rates are pinned. Across 333 rolling five-year windows, duration matching and surplus optimisation were positive in 100% of them, with the narrowest distributions; all-equities had the highest median (+11.30%) but was negative in 27.3%.
Implication. A duration gap is a number that can be written directly into a risk limit, and the equity weight should be a function of the funding ratio rather than a committee preference. Limitations. The liability is synthetic and discounted off a single yield, without lapse or renewal options or new-business duration drift; the asset menu is six legs, long-only and unlevered, with no swaps or inflation-linked bonds; everything is US; costs are included, taxes, funding and margin are not; and the shortfall probabilities come from 392 months containing only two complete hiking cycles, so the tail is optimistic.
附录 A · 数据、口径与已知偏差Appendix A · data, conventions and known biases
一:负债的构造。一笔 20 年期定额年金(每年支付 1 个单位),按当月 10 年期美国国债收益率平折现:Lt = Σk=1..20 (1 + yt)−k。采用恒定到期假设——每年新业务补上滚出的部分——所以久期不随时间缩短,样本内修正久期落在 7.9–9.9 年。注意这里用的是修正久期(麦考利 ÷ (1+y)),因为站上资产端债券腿的月度收益是「票息 − 久期 × Δy」,那个久期就是修正久期;两边口径不一致会直接让久期匹配解错。
1: constructing the liability. A 20-year level annuity (one unit a year) discounted flat at that month's 10-year Treasury yield: Lt = Σk=1..20 (1 + yt)−k. A constant-maturity assumption — new business replaces what rolls off — keeps duration from shortening, leaving it between 7.9 and 9.9 years. Note the use of modified duration (Macaulay ÷ (1+y)): the site's bond legs earn "carry − duration × Δy" with modified duration, and mixing the two conventions breaks the duration match outright.
二:资产端。股票=标普 500 全收益(Yahoo Finance);三条债券腿由美国财政部收益率曲线合成,久期分别取 15 / 7.5 / 1.9;黄金=LBMA 伦敦金价;商品=世界银行 Pink Sheet 能源、金属、食品三条指数的月度收益等权合成。现金=3 个月国库券。
2: the asset side. Equities are the S&P 500 total return index (Yahoo Finance); the three bond legs are synthesised from the US Treasury yield curve at durations of 15, 7.5 and 1.9; gold is the LBMA London fix; commodities are the equal-weighted monthly return of the World Bank Pink Sheet energy, metals and food indices; cash is the three-month T-bill.
三:再平衡与成本。所有组合月度再平衡;久期匹配每月重解目标久期,风险平价与盈余最优化每年 1 月用最近 36 个月重解一次权重。成本按权重变动的绝对值计,股票、长债、中债各 2 个基点,短债 1 个,黄金 3 个,商品 5 个,均为单边。
3: rebalancing and costs. Every portfolio rebalances monthly; duration matching re-solves its target monthly, while risk parity and surplus optimisation re-solve each January on the trailing 36 months. Costs are charged on the absolute change in weight: two basis points for equities and both long and intermediate bonds, one for short bonds, three for gold and five for commodities, all one way.
四:与站上其他笔记的关系。数据管线与《1/N 打败最优化》《风险平价实测》《全天候组合实测》《永久组合实测》完全同源,但那几篇是资产端研究,本篇把基准换成了负债;因此组合层面的数字不可直接与那几篇对照。本文的资产端数字(例如纯股年化 10.80%)与《1/N 打败最优化》一致,负债端是本篇新增。
4: relation to the other notes. The data pipeline is the same one behind the 1/N, risk-parity, All Weather and Permanent Portfolio notes, but those are asset-side studies while this one replaces the benchmark with a liability; portfolio-level figures are therefore not directly comparable. The asset-side numbers here (all-equities at 10.80% a year, for instance) match the 1/N note exactly; everything on the liability side is new.
五:已知偏差。(a)单一利率平折现,真实负债用的是分期限贴现曲线;(b)没有退保、续保与年金领取选择权,这类选择权会让负债的凸性比本文更大;(c)恒定到期假设抹掉了新业务带来的久期漂移;(d)资产端没有利率互换与通胀挂钩债券,而这两样是真实负债驱动组合最常用的精细对冲工具;(e)「一年跌破 100%」的概率由 392 个月的经验频率估计,样本只含两个完整加息周期,尾部偏乐观;(f)全部为历史回测,不构成任何真实偿付能力判断。
5: known biases. (a) A single flat discount rate, where real liabilities use a term structure. (b) No lapse, renewal or annuitisation options, which in practice make the liability more convex than modelled here. (c) The constant-maturity assumption removes the duration drift that new business creates. (d) No interest-rate swaps and no inflation-linked bonds, the two instruments real liability-driven portfolios use most for fine hedging. (e) The one-year shortfall probabilities come from 392 months containing only two complete hiking cycles, so the tail is optimistic. (f) These are historical backtests and constitute no statement about any real solvency position.
附录 B · 两张数据表Appendix B · two data tables
表 B-1 是七个组合的全量指标,含资产久期、年度换手与盈余端的全部读数。
Table B-1 is the full statistics for the seven portfolios, including asset duration, annual turnover and every surplus-side reading.
| 组合Portfolio | 资产年化 %Return % | 资产波动 %Vol % | 资产夏普Sharpe | 资产回撤 %Max DD % | 资产久期Duration | 换手Turnover | 盈余年化 %Surplus % | 盈余波动 %Surplus vol % | 盈余夏普Surplus Sharpe | 盈余回撤 %FR DD % | FR 终值FR end |
|---|---|---|---|---|---|---|---|---|---|---|---|
| 纯股All equity | 10.80 | 14.8 | 0.60 | -50.9 | 0.00 | 0.00 | 10.00 | 17.71 | 0.49 | -58.9 | 2248 |
| 60/4060/40 | 8.48 | 9.1 | 0.67 | -29.6 | 3.00 | 0.00 | 7.69 | 10.97 | 0.51 | -39.9 | 1126 |
| 1/N 等权1/N equal weight | 6.28 | 5.3 | 0.71 | -15.2 | 4.07 | 0.00 | 5.51 | 6.96 | 0.45 | -24.4 | 576 |
| 风险平价Risk parity, ERC | 4.94 | 4.1 | 0.59 | -8.8 | 3.26 | 0.28 | 4.17 | 6.74 | 0.27 | -15.8 | 380 |
| 匹配 + 成长Duration match + growth | 7.23 | 7.1 | 0.67 | -22.1 | 5.40 | 0.04 | 6.45 | 7.48 | 0.54 | -26.8 | 771 |
| 久期匹配Duration matched | 4.27 | 7.7 | 0.26 | -30.1 | 9.00 | 0.07 | 3.51 | 2.15 | 0.47 | -2.4 | 309 |
| 盈余最优化Surplus optimised | 4.33 | 6.9 | 0.29 | -25.4 | 7.22 | 0.07 | 3.57 | 2.03 | 0.52 | -3.6 | 315 |
表 B-2 是五个利率环境里 funding ratio 的累计变化,横着读可以看同一环境下谁抗住了、谁没抗住。
Table B-2 is the cumulative change in the funding ratio across the five rate environments; read across a row to see who held up in each one.
| 组合Portfolio | 降息前半段 1994-01 → 2000-12 Δy -0.58ppFirst easing leg 1994-01 → 2000-12 Δy -0.58pp | 降息后半段 2001-01 → 2012-12 Δy -3.90ppSecond easing leg 2001-01 → 2012-12 Δy -3.90pp | 零利率时代 2013-01 → 2021-12 Δy -0.12ppZero-rate era 2013-01 → 2021-12 Δy -0.12pp | 快速加息 2022-01 → 2023-12 Δy +2.62ppFast hiking 2022-01 → 2023-12 Δy +2.62pp | 样本末段 2024-01 → 2025-09 Δy -0.45ppFinal stretch 2024-01 → 2025-09 Δy -0.45pp |
|---|---|---|---|---|---|
| 纯股All equity | +204.8 | -5.1 | +302.0 | +33.9 | +38.4 |
| 60/4060/40 | +134.1 | +16.6 | +151.2 | +25.5 | +25.0 |
| 1/N 等权1/N equal weight | +47.9 | +78.1 | +44.8 | +22.6 | +18.8 |
| 风险平价Risk parity, ERC | +37.0 | +39.4 | +37.6 | +24.0 | +12.3 |
| 匹配 + 成长Duration match + growth | +104.2 | +28.2 | +98.1 | +18.5 | +19.1 |
| 久期匹配Duration matched | +51.7 | +41.2 | +17.4 | +8.1 | +7.1 |
| 盈余最优化Surplus optimised | +56.4 | +38.2 | +17.2 | +12.2 | +6.8 |
参考文献References
- Redington, F. M. (1952). Review of the Principles of Life-Office Valuations. Journal of the Institute of Actuaries, 78(3), 286–340. doi.org/10.1017/S0020268100052811
- Sharpe, W. F., & Tint, L. G. (1990). Liabilities—A New Approach. The Journal of Portfolio Management, 16(2), 5–10. doi.org/10.3905/jpm.1990.409248
- Leibowitz, M. L., Kogelman, S., & Bader, L. N. (1994). Funding Ratio Return. The Journal of Portfolio Management, 21(1), 39–47. doi.org/10.3905/jpm.1994.409495
- Markowitz, H. (1952). Portfolio Selection. The Journal of Finance, 7(1), 77–91. doi.org/10.1111/j.1540-6261.1952.tb01525.x
- Michaud, R. O. (1989). The Markowitz Optimization Enigma: Is 'Optimized' Optimal? Financial Analysts Journal, 45(1), 31–42. doi.org/10.2469/faj.v45.n1.31
- Ledoit, O., & Wolf, M. (2004). Honey, I Shrunk the Sample Covariance Matrix. The Journal of Portfolio Management, 30(4), 110–119. doi.org/10.3905/jpm.2004.110
- Maillard, S., Roncalli, T., & Teïletche, J. (2010). The Properties of Equally Weighted Risk Contribution Portfolios. The Journal of Portfolio Management, 36(4), 60–70. doi.org/10.3905/jpm.2010.36.4.060
- 数据:Yahoo Finance ^SP500TR、美国财政部国债收益率曲线、LBMA 伦敦金价、世界银行 Pink Sheet 商品价格指数,访问日期 2026-10-09。Data: Yahoo Finance ^SP500TR, US Treasury yield curve, LBMA London gold fix, World Bank Pink Sheet commodity price indices, accessed 9 October 2026.