从观点到组合:基准赢了,流程留下了什么? From Views to Weights: the benchmark won. What survives is the process.
一个公开的多资产影子组合,从冻结策略、月度调仓到风险贡献和收益归因,走完了完整研究闭环。同期 60/40 是赢家:5.86% 的静态配置和 5.20% 的趋势增强组合,都没有追上 60/40 的 8.43%。但这个项目真正留下的不是“跑赢基准”的故事,而是一套能被复核、能被否决、也能被继续维护的投资流程。 A public multi-asset shadow portfolio runs the full research loop: frozen policy, monthly rebalancing, risk contribution and return attribution. The 60/40 wins: both the 5.86% strategic portfolio and the 5.20% trend overlay trail its 8.43% annual return. What the project leaves behind is not a winning-alpha story, but an investment process that can be audited, rejected and maintained.
- 基准赢了。2008-06 至 2026-10 的 221 个月里,60/40 年化 8.43%、夏普 0.894;L1 TAA 年化 5.20%、夏普 0.703。The benchmark won. Across 221 months from June 2008 to October 2026, the 60/40 earned 8.43% a year with a 0.894 Sharpe; L1 TAA earned 5.20% with 0.703.
- 趋势层降低了波动,没有提高收益。权益趋势为 10 个月收益符号;当期三条权益腿全为正,因此战术组合接近战略配置。The trend overlay lowered volatility, not return. The signal is the sign of the trailing ten-month equity return; all three equity signals are positive, so the tactical portfolio remains near strategic weights.
- 资金权重不等于风险权重。三类权益占资金的 40%,却贡献约 61% 的模型方差。Capital weights are not risk weights. The three equity sleeves hold 40% of capital but drive about 61% of model variance.
- 研究可信度来自治理。策略版本冻结、调仓规则预先写明、负结果保留,并在下一次月末复核前不追溯修改。Research credibility comes from governance. The policy is versioned, the rebalance rule is written in advance, negative results are retained, and the record is never edited retrospectively.
摘要本文展示 L1 公开多资产影子组合:8 个美国上市 ETF、HKD 计价、月度再平衡、10 bps 单边换手成本假设,并用 10 个月权益趋势做有限战术覆盖。评价期为 2008-06 至 2026-10,共 221 个月。L1 SAA 年化 5.86%,L1 TAA 年化 5.20%;同期 60/40 代理组合年化 8.43%、夏普 0.894。结果显示分散化和趋势规则没有创造超额收益,但把“观点 → 权重 → 风险 → 归因 → 决策记录”的过程变成可复现系统。 AbstractThis note presents the public L1 multi-asset shadow portfolio: eight US-listed ETFs, HKD reporting, monthly rebalancing, a 10 bps one-way turnover cost assumption and a bounded ten-month equity trend overlay. The evaluation covers 221 months from June 2008 to October 2026. L1 SAA earned 5.86% a year and L1 TAA 5.20%; a 60/40 proxy earned 8.43% with a 0.894 Sharpe. Diversification and trend did not generate excess return. Their contribution was to turn “view → weight → risk → attribution → decision record” into a reproducible system.
关键词 SAA · TAA · 影子组合 · 风险贡献 · 收益归因 · 回测治理Keywords SAA · TAA · shadow portfolio · risk contribution · return attribution · backtest governance
01投资问题The investment question
这个项目不试图证明某个信号一定赚钱。它回答一个更接近资产配置前台的问题:给定一套明确的政策权重、风险约束和调仓规则,组合每个月应该如何从观点走到仓位,又如何在事后解释结果?This project does not try to prove that a signal must make money. It answers a question closer to an allocation desk: given explicit policy weights, risk constraints and rebalancing rules, how should a portfolio move from views to positions each month, and how should the result be explained afterwards?
因此,项目把研究分成四层:战略配置(SAA)、有限战术覆盖(TAA)、组合执行与成本、风险与收益归因。这个顺序也是买方投资流程的基本接口:观点不能直接变成交易,交易不能脱离风险预算,结果不能只报收益。The research therefore separates four layers: strategic allocation (SAA), a bounded tactical overlay (TAA), execution and costs, and risk and return attribution. That is also the basic buy-side interface: a view cannot become a trade directly, a trade cannot escape the risk budget, and results cannot be reported through return alone.
为什么它适合作为转型作品?它同时展示资产配置、Python 工程、回测纪律和投资备忘录写作,而且使用公开数据,不依赖任何内部材料。Why is it useful as a transition project? It demonstrates asset allocation, Python engineering, backtest discipline and investment memo writing in one place — using public data only.
02研究设计Research design
政策组合把资金分成 40% 权益、35% 固定收益与信用、10% 黄金、5% 商品和 10% 短债。所有资产都用美国上市 ETF 作为公开代理,把美元收益按 USD/HKD 换算成 HKD;没有汇率对冲。The policy portfolio allocates 40% to equities, 35% to fixed income and credit, 10% to gold, 5% to commodities and 10% to bills. Every asset uses a US-listed ETF as a public proxy. USD returns are translated into HKD using USD/HKD, with no FX hedge.
调仓频率为月度。权益趋势只看截至上个月末的 10 个月收益:信号为正则维持政策权重,为负则把该权益腿减半,并把释放出的资金转入短债。每次换手按 10 bps 计成本。政策在 2026-10-30 冻结为 policy_v1,之后若改变规则,必须生成新版本。Rebalancing is monthly. The equity trend signal uses only the trailing ten-month return through the prior month-end: a positive signal keeps the policy weight; a negative signal halves that sleeve and moves the proceeds to bills. Every unit of turnover costs 10 bps. The policy was frozen as policy_v1 on 30 October 2026; any later rule change requires a new version.
评价口径:L1 SAA 始终按政策权重运行;L1 TAA 加入趋势覆盖;60/40 代理组合是 60% SPY + 40% IEF;等权组合是八个资产各 12.5%。所有比较使用同一评价期和同一成本口径。Evaluation set: L1 SAA always follows policy weights; L1 TAA adds the trend overlay; the 60/40 proxy is 60% SPY and 40% IEF; equal weight gives all eight assets 12.5%. All comparisons use the same period and cost convention.
03全样本结果Full-sample result
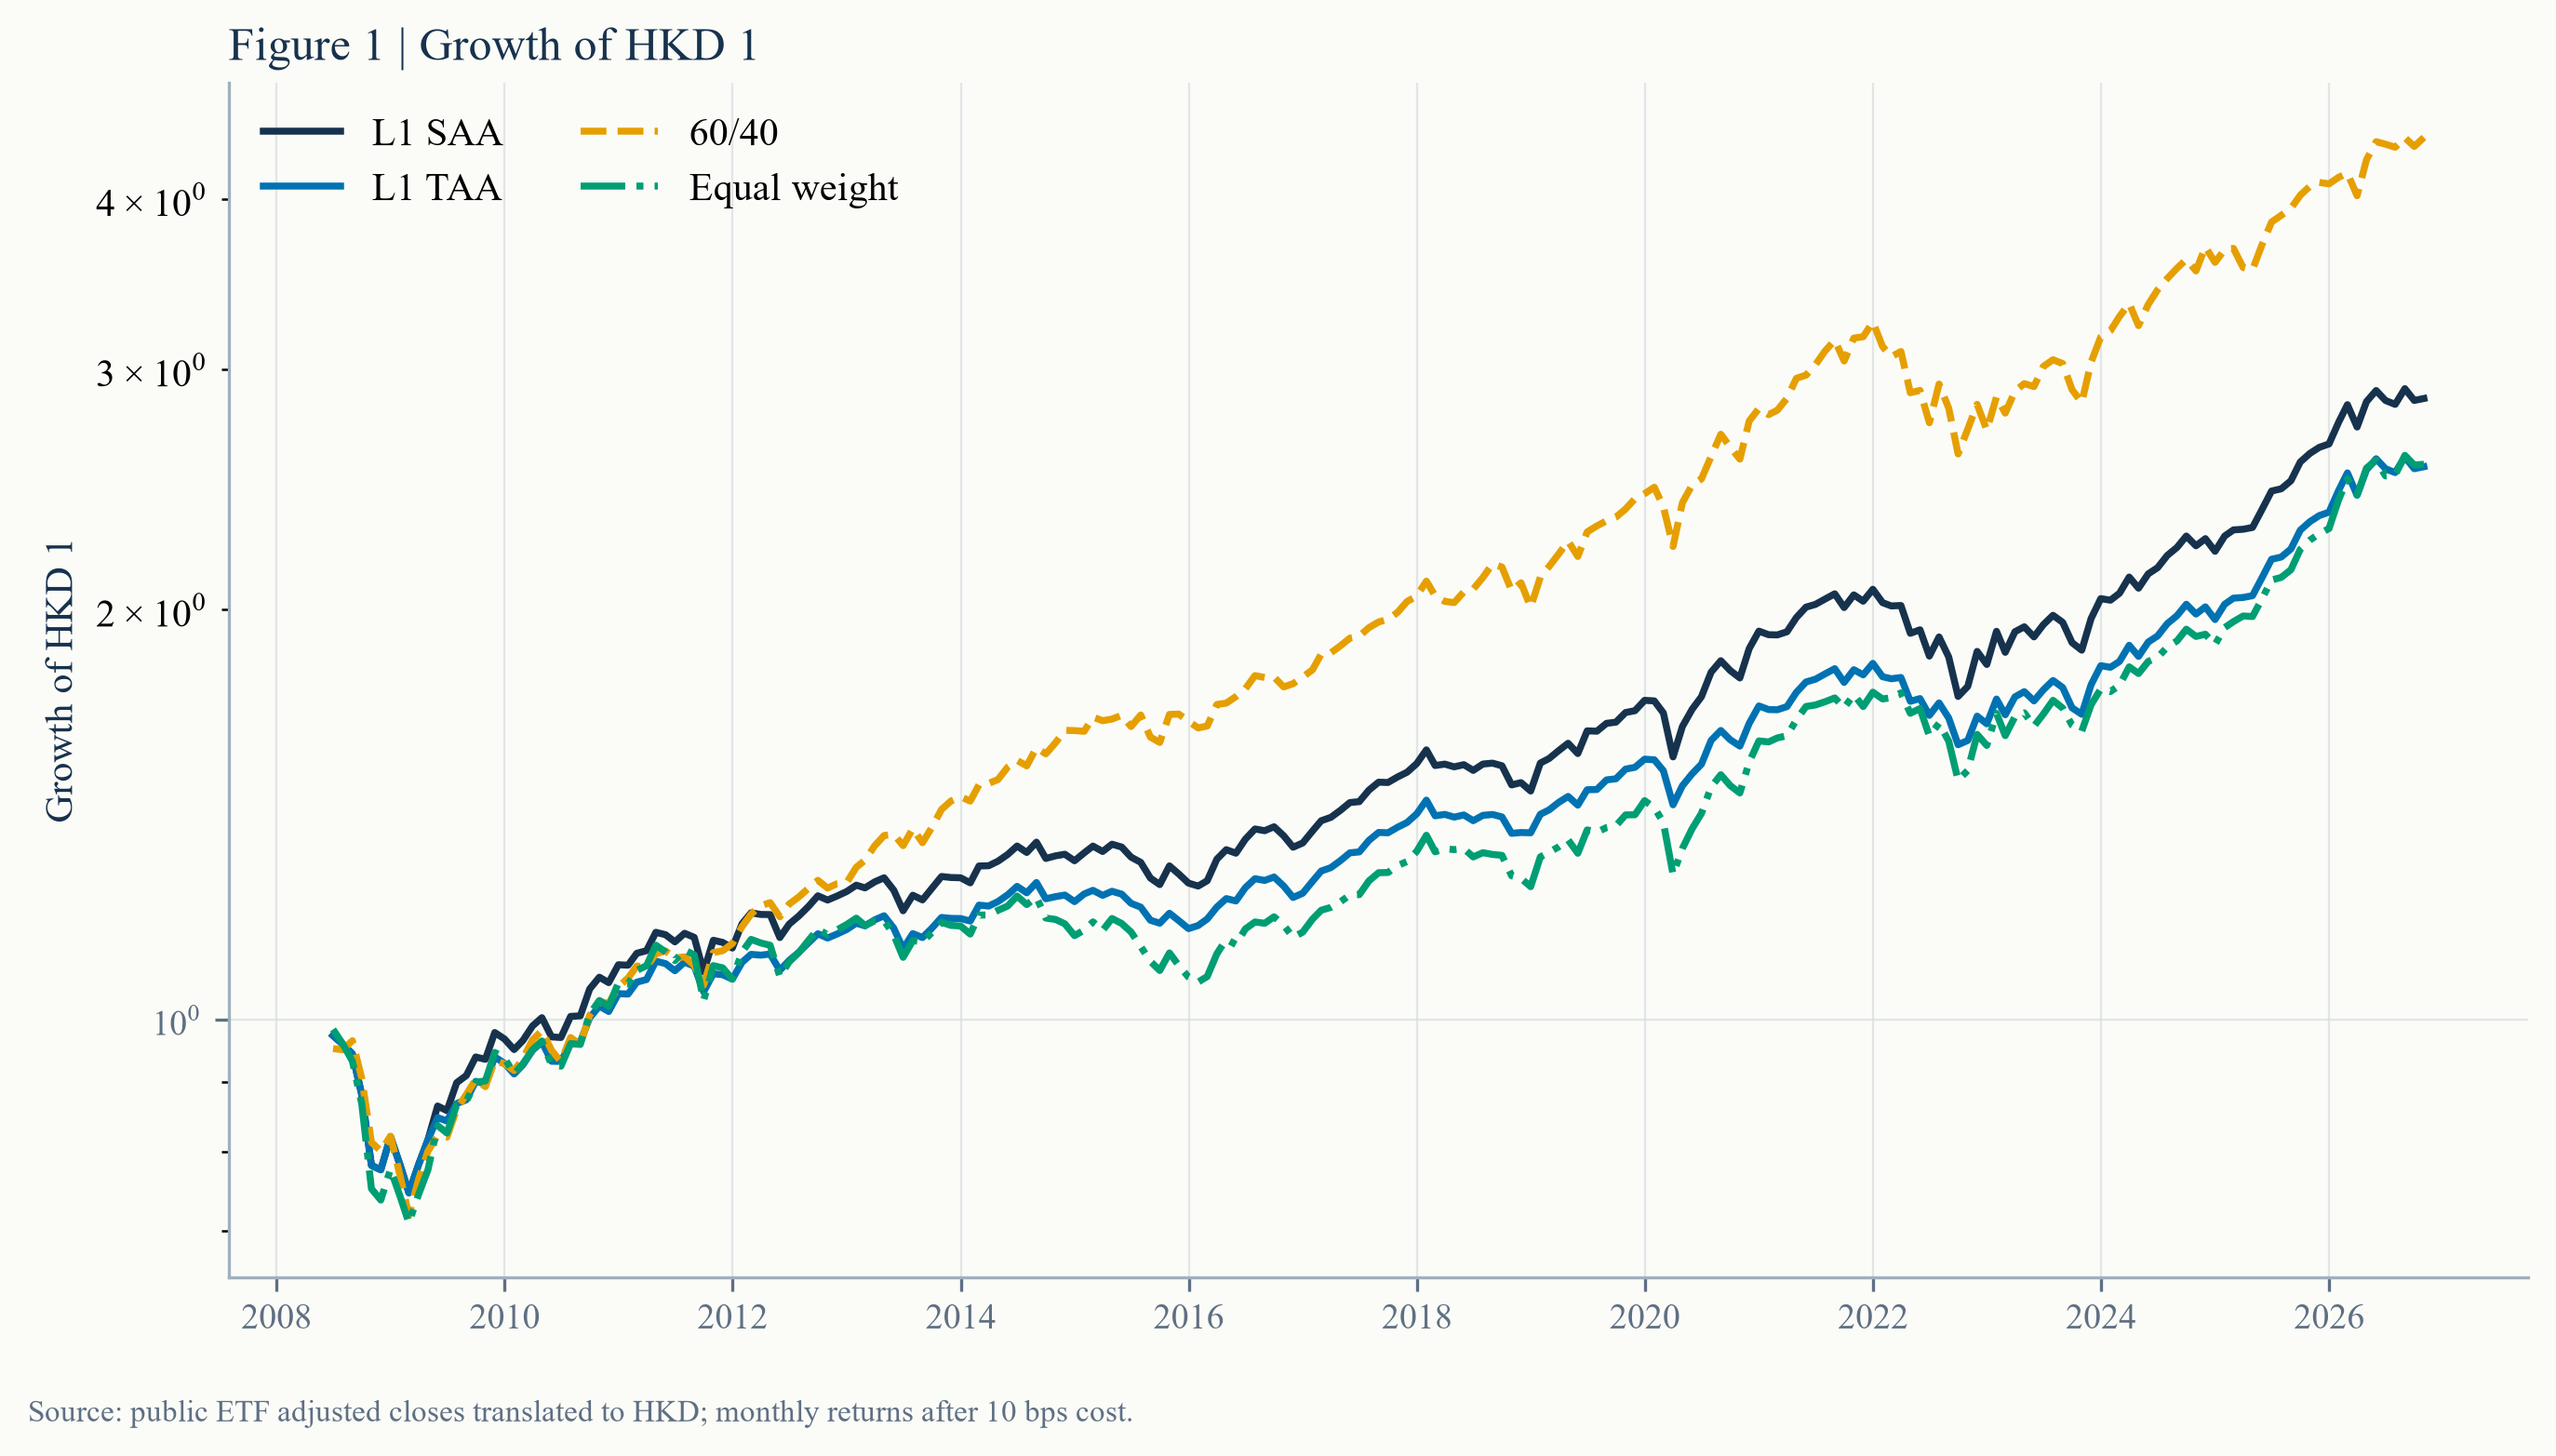
60/40 的终值明显高于两个 L1 组合。趋势覆盖降低了波动,但没有改变落后于权益占比较高的基准这一事实。The 60/40 compounds to a materially higher terminal value. The trend overlay lowers volatility, but it does not change the fact that the portfolio trails a benchmark with a larger equity allocation.
来源:L1 项目公开结果,2008-06 至 2026-10;月度再平衡并按 10 bps 成本计费。Source: public L1 results, June 2008 to October 2026; monthly rebalancing with a 10 bps cost assumption.
| 组合Portfolio | 年化CAGR | 波动Volatility | 夏普Sharpe | 最大回撤Max drawdown |
|---|---|---|---|---|
| L1 SAA | 5.86% | 8.68% | 0.702 | -23.32% |
| L1 TAA | 5.20% | 7.64% | 0.703 | -23.32% |
| 60/40 proxy | 8.43% | 9.60% | 0.894 | -25.56% |
| Equal weight | 5.23% | 9.40% | 0.590 | -27.87% |
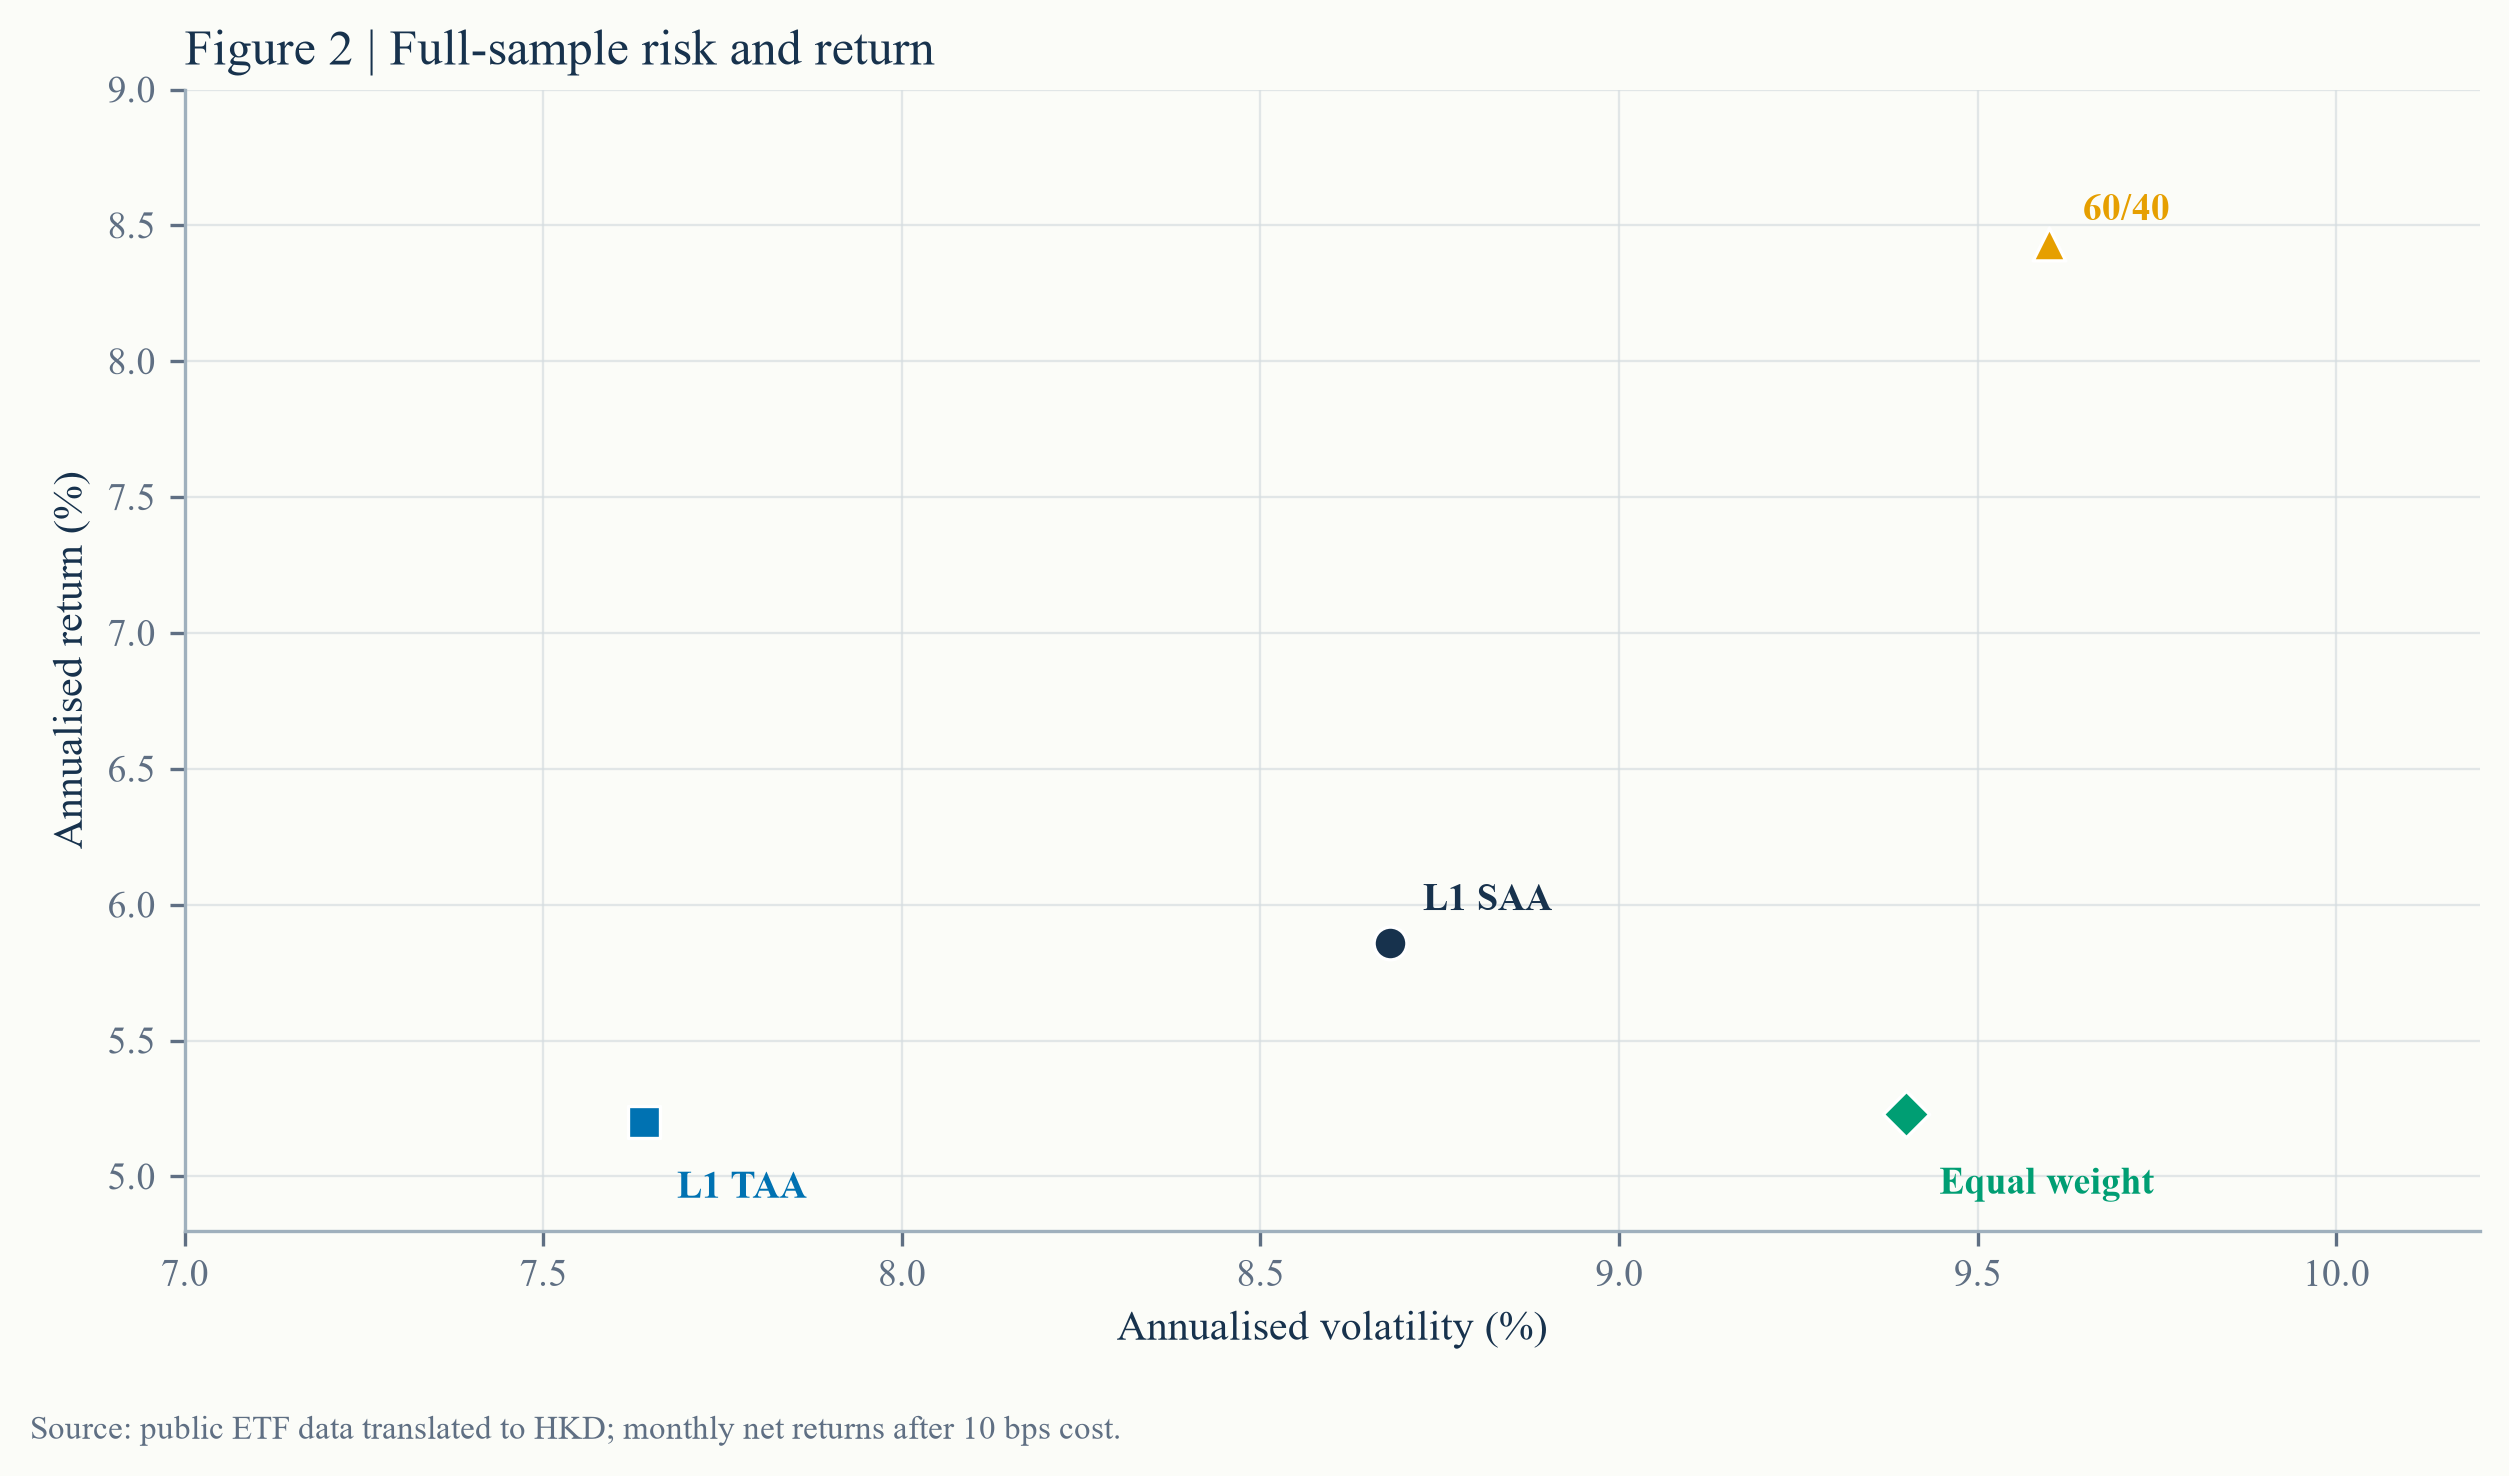
这张图把上表压缩成一个直观判断:60/40 位于更高的收益位置,但不是最低波动;L1 TAA 在最左侧,以更低风险换取更低收益。三条组合点彼此接近也提醒我们,样本结果不足以证明长期优势,更不能把一次回测当作 alpha。The chart compresses the table into one visual judgement: the 60/40 sits higher on return but is not the lowest-volatility portfolio; L1 TAA sits furthest left, trading lower risk for lower return. The proximity of three portfolios is also a warning: one sample does not establish a durable advantage, let alone alpha.
来源:L1 项目公开结果;年化收益和波动均由同一组月度净收益计算。Source: public L1 results; CAGR and volatility are calculated from the same monthly net-return series.
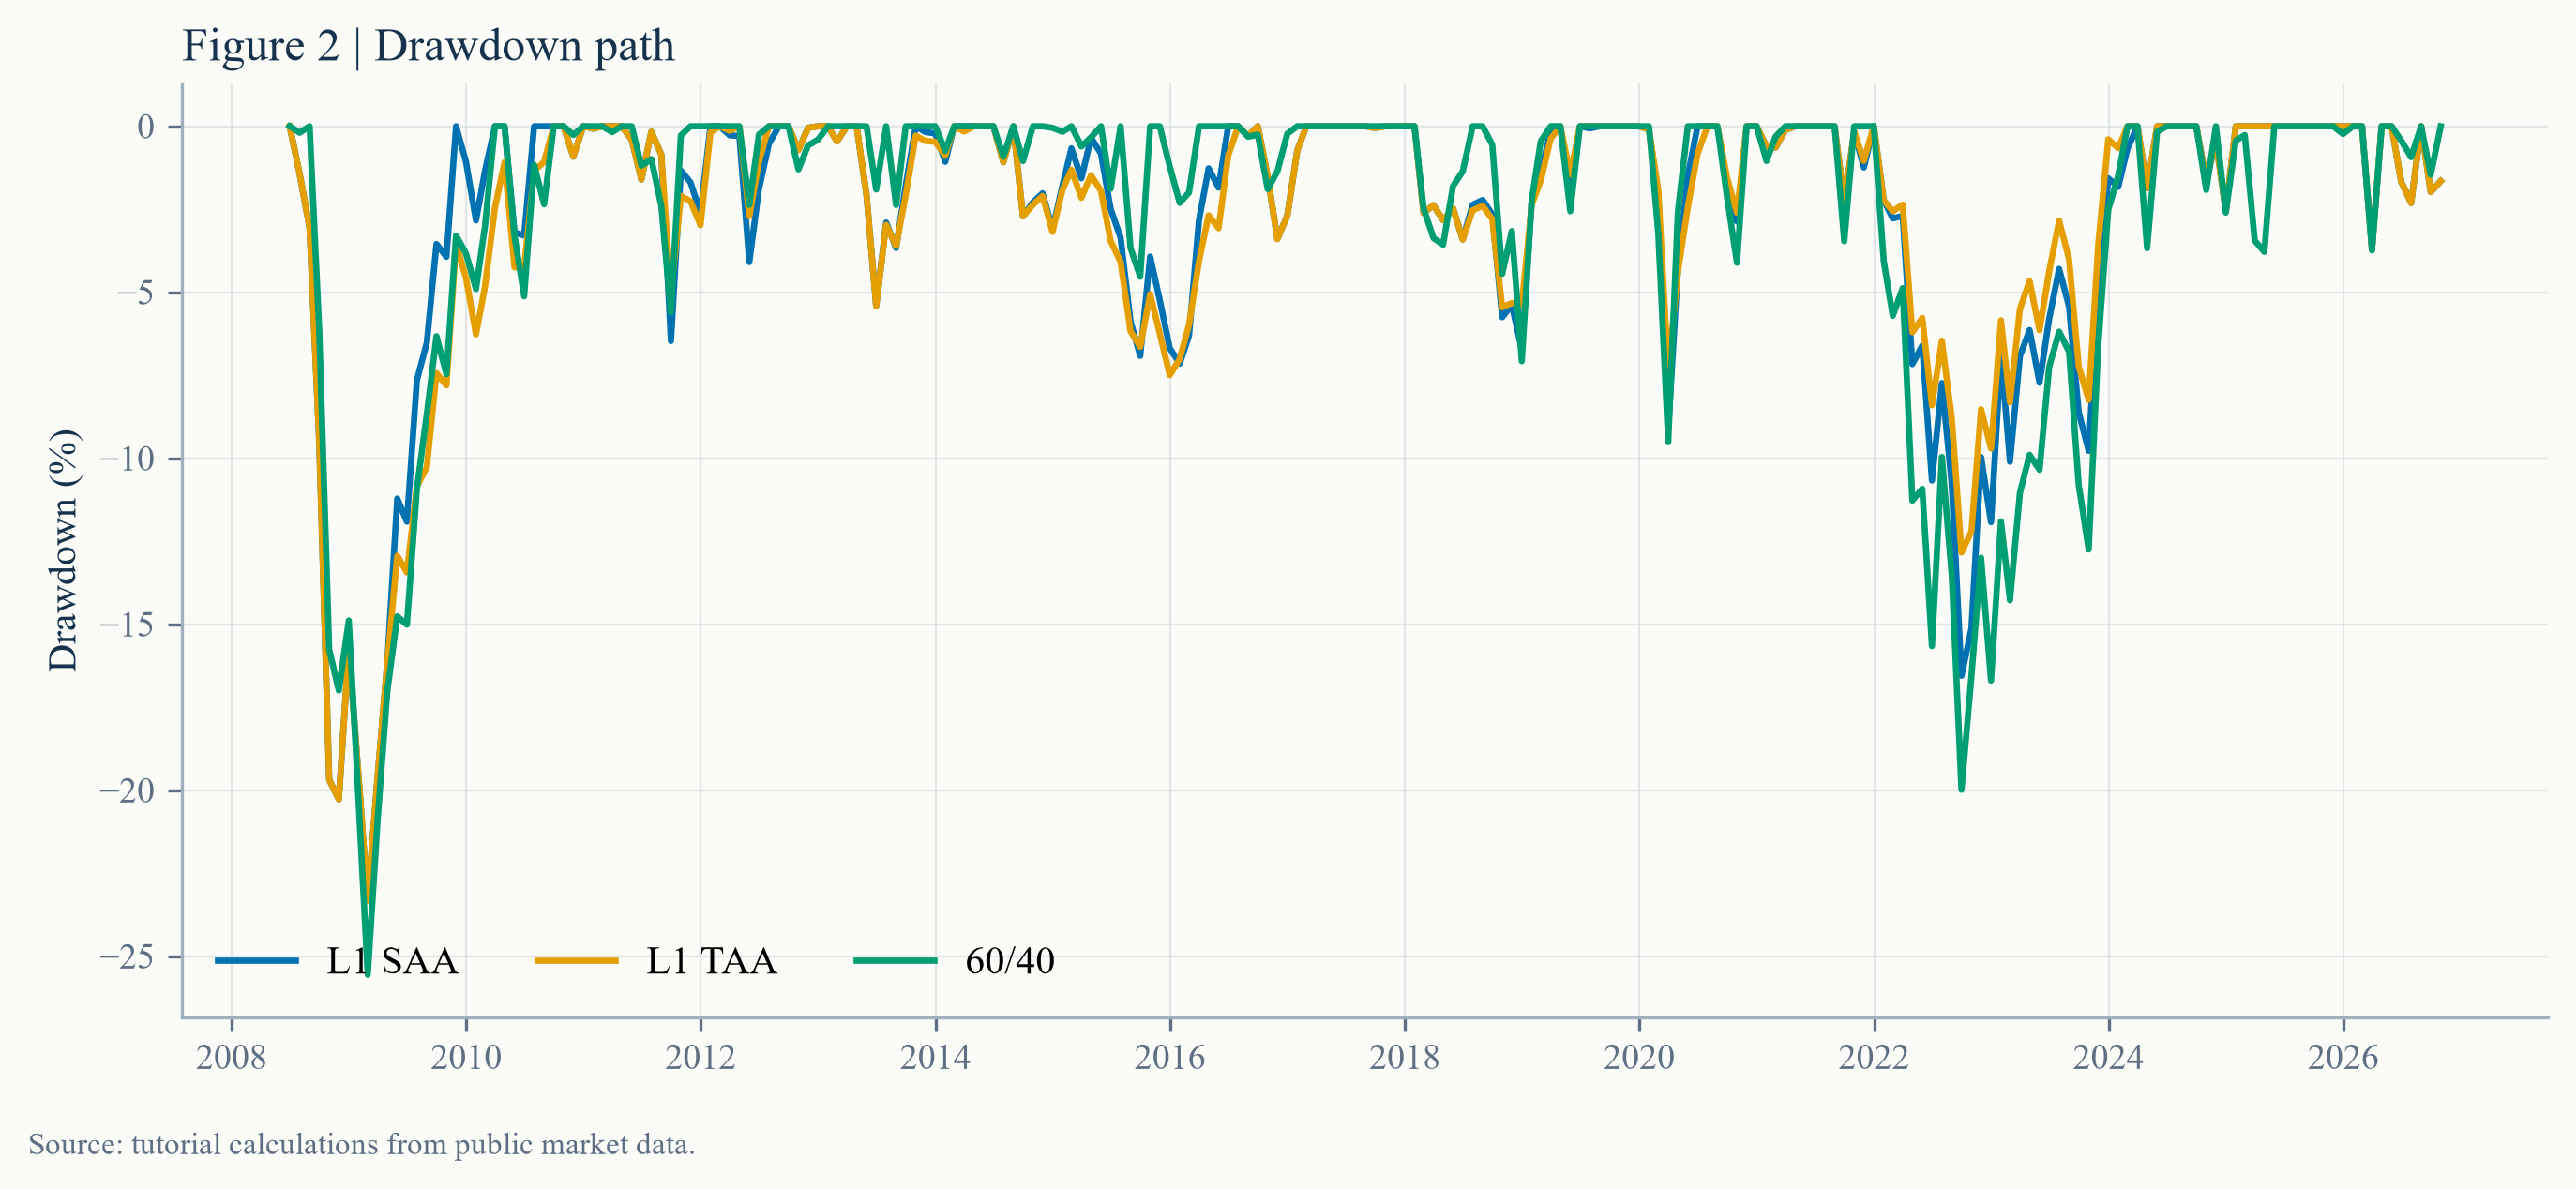
L1 TAA 的最大回撤为 −23.32%,略浅于 60/40 的 −25.56%。这不是充分证据说明趋势规则更安全;它只是这段样本的一个结果,且两个组合的回撤窗口并不完全由同一个风险源决定。L1 TAA's maximum drawdown is −23.32%, modestly shallower than −25.56% for the 60/40. This is not sufficient evidence that the trend rule is safer; it is one result in one sample, and the two portfolios are not exposed to exactly the same risk drivers.
来源:L1 项目公开结果;回撤按月末净值计算。Source: public L1 results; drawdowns calculated from month-end NAV.
04当前配置Current allocation
截至 2026-10-30,三条权益趋势信号全部为正:SPY 14.65%、VEA 14.82%、EEM 16.19%。所以本月没有触发权益减仓,实际权重与政策权重非常接近;差异主要来自价格漂移和最近一次再平衡。As of 30 October 2026, all three equity trend signals are positive: SPY 14.65%, VEA 14.82% and EEM 16.19%. No equity reduction is active, so live paper weights remain close to policy. Differences come mainly from price drift and the latest rebalance.
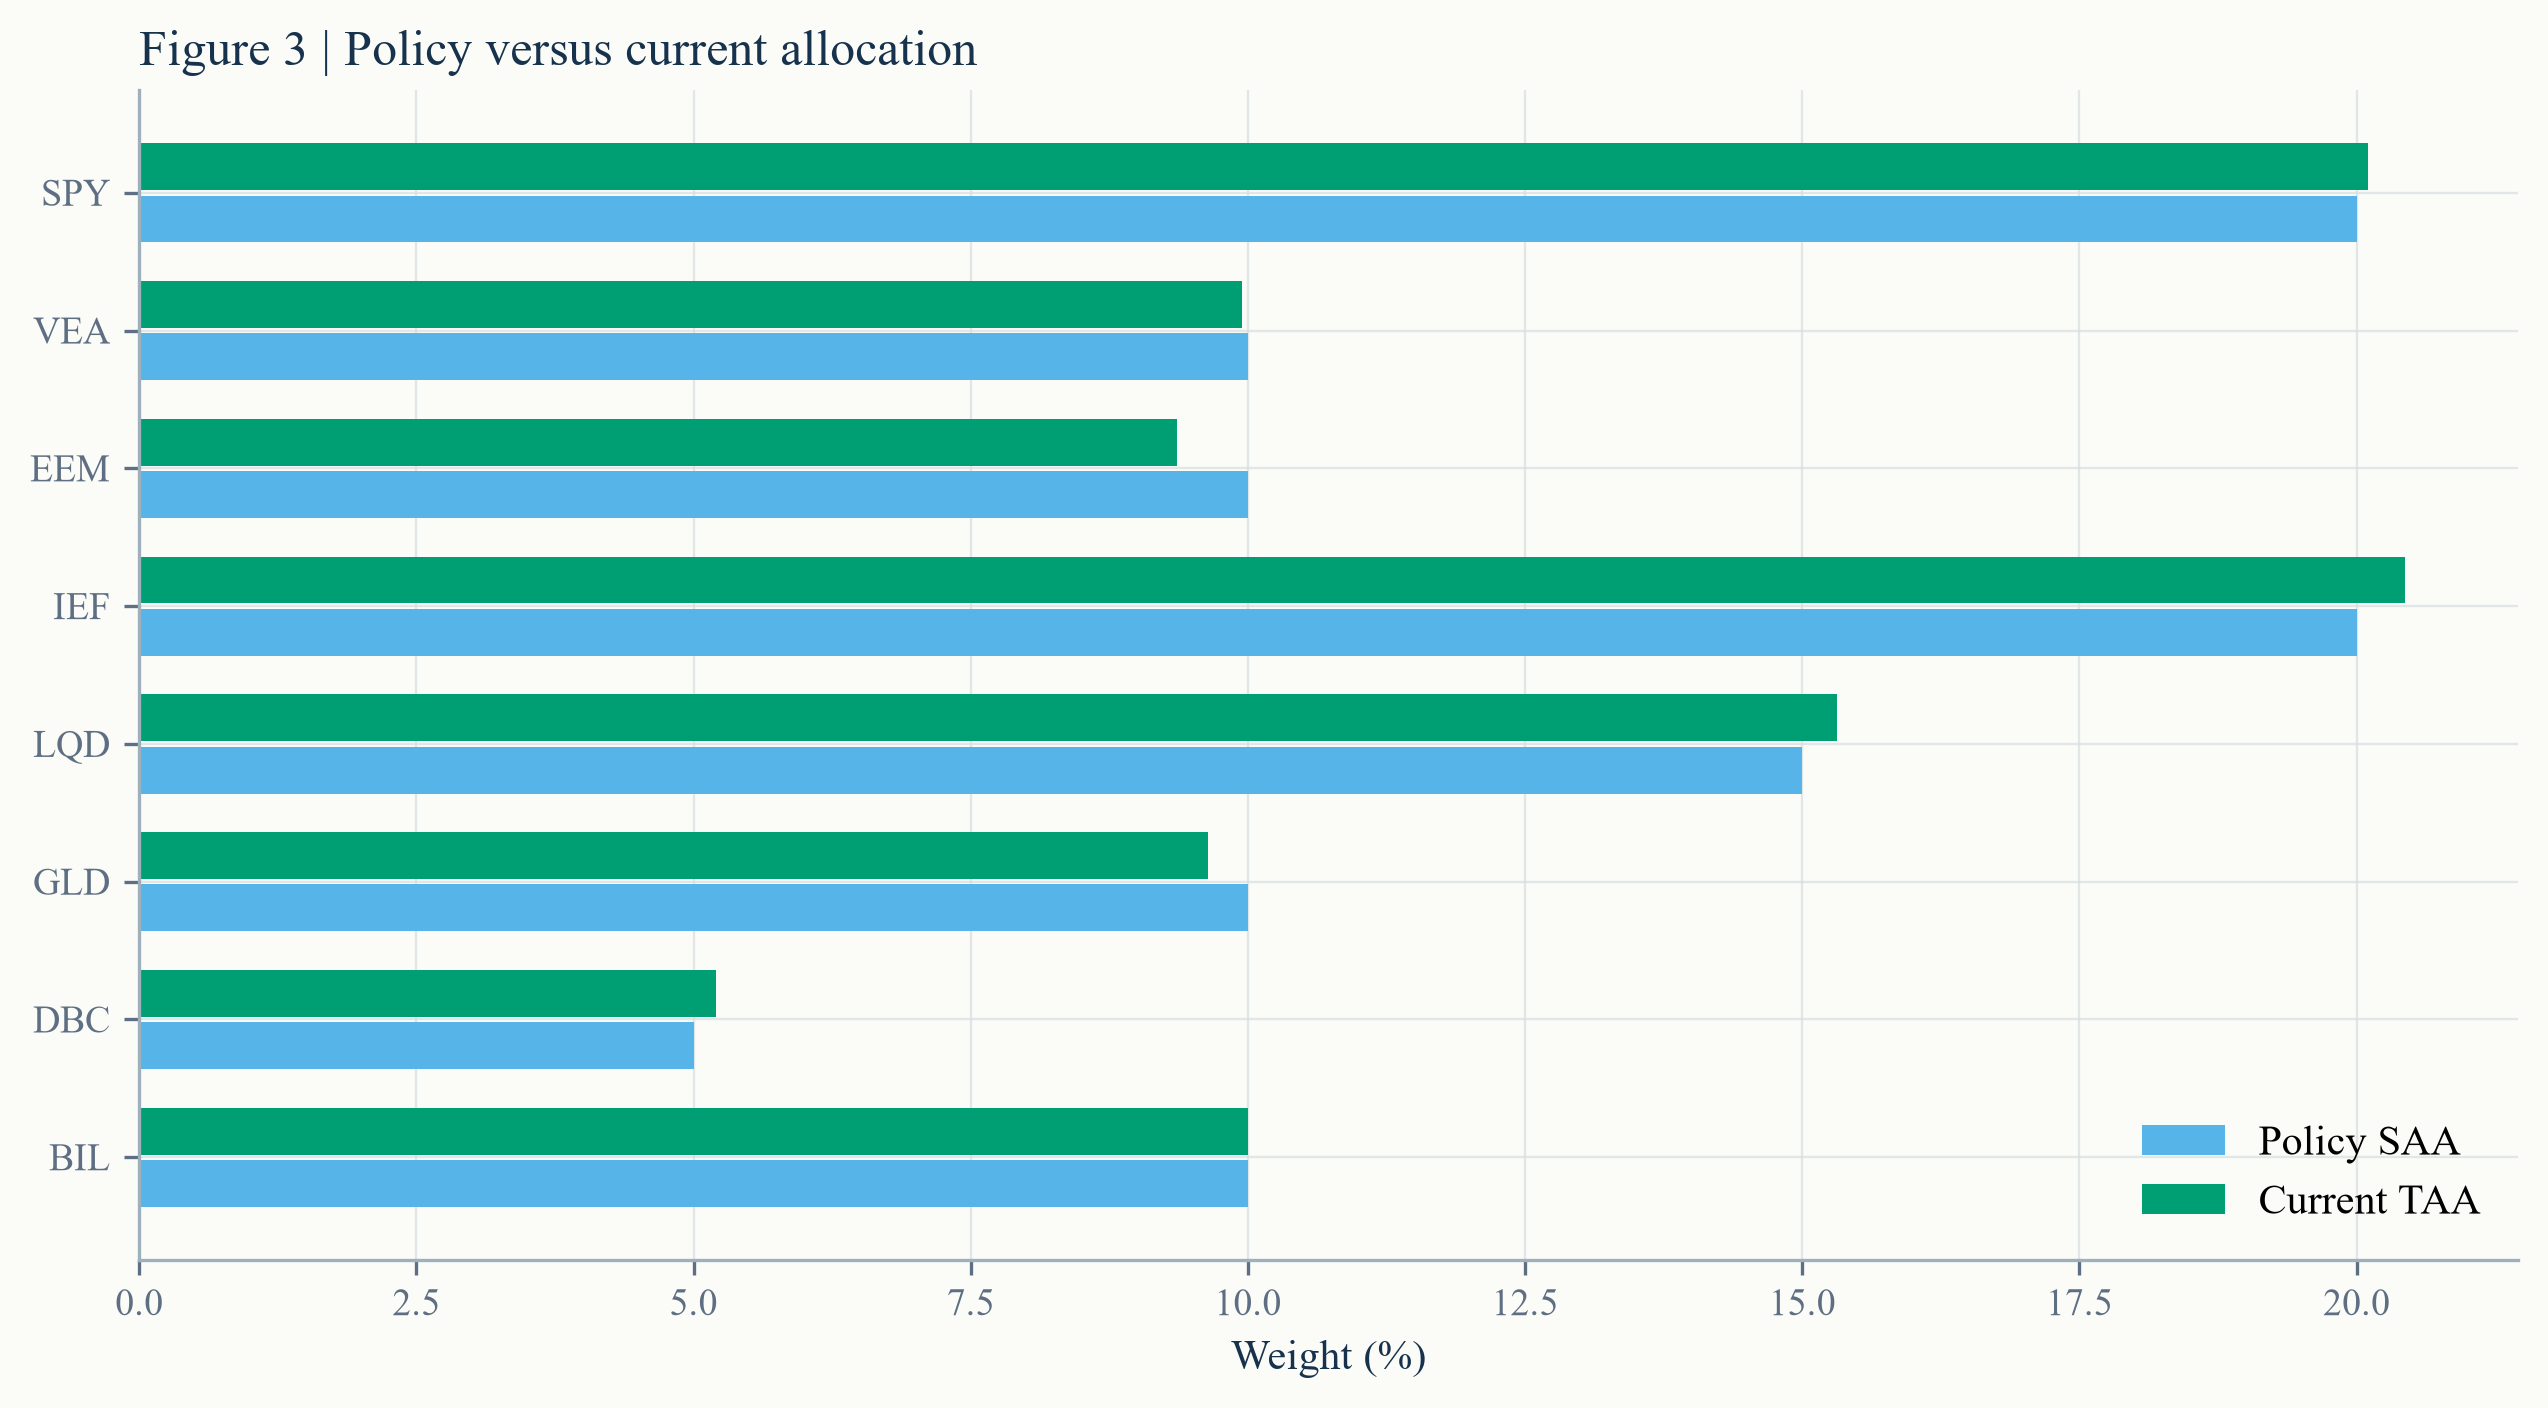
当前 SPY 20.11%、VEA 9.95%、EEM 9.36%、IEF 20.43%、LQD 15.31%、GLD 9.64%、DBC 5.20%、BIL 10.00%。列表本身就是决策留痕:同一个版本下,任何权重变化都应能追溯到规则或价格漂移。Current weights are SPY 20.11%, VEA 9.95%, EEM 9.36%, IEF 20.43%, LQD 15.31%, GLD 9.64%, DBC 5.20% and BIL 10.00%. The list is itself a decision record: within one policy version, every weight change should trace back to a rule or to price drift.
来源:L1 项目 latest_weights.csv;月末复核快照。Source: L1 latest_weights.csv; month-end review snapshot.
05风险贡献Risk contribution
只看资金权重会漏掉最重要的信息。三类权益占资金 40%,却贡献约 61% 的模型方差。SPY 一个资产就贡献 27.46%,超过其 20% 的资金权重;IEF 和 LQD 各约 13%,黄金约 13.90%。DBC 的风险贡献为 −1.07%,说明它与组合其余部分存在分散效应,但这不等于它一定改善收益。Capital weights miss the most important information. Equities hold 40% of capital but contribute about 61% of model variance. SPY alone contributes 27.46%, above its 20% capital weight; IEF and LQD each contribute roughly 13%, and gold 13.90%. DBC's risk contribution is −1.07%, evidence of a diversification effect — not proof that it improves return.
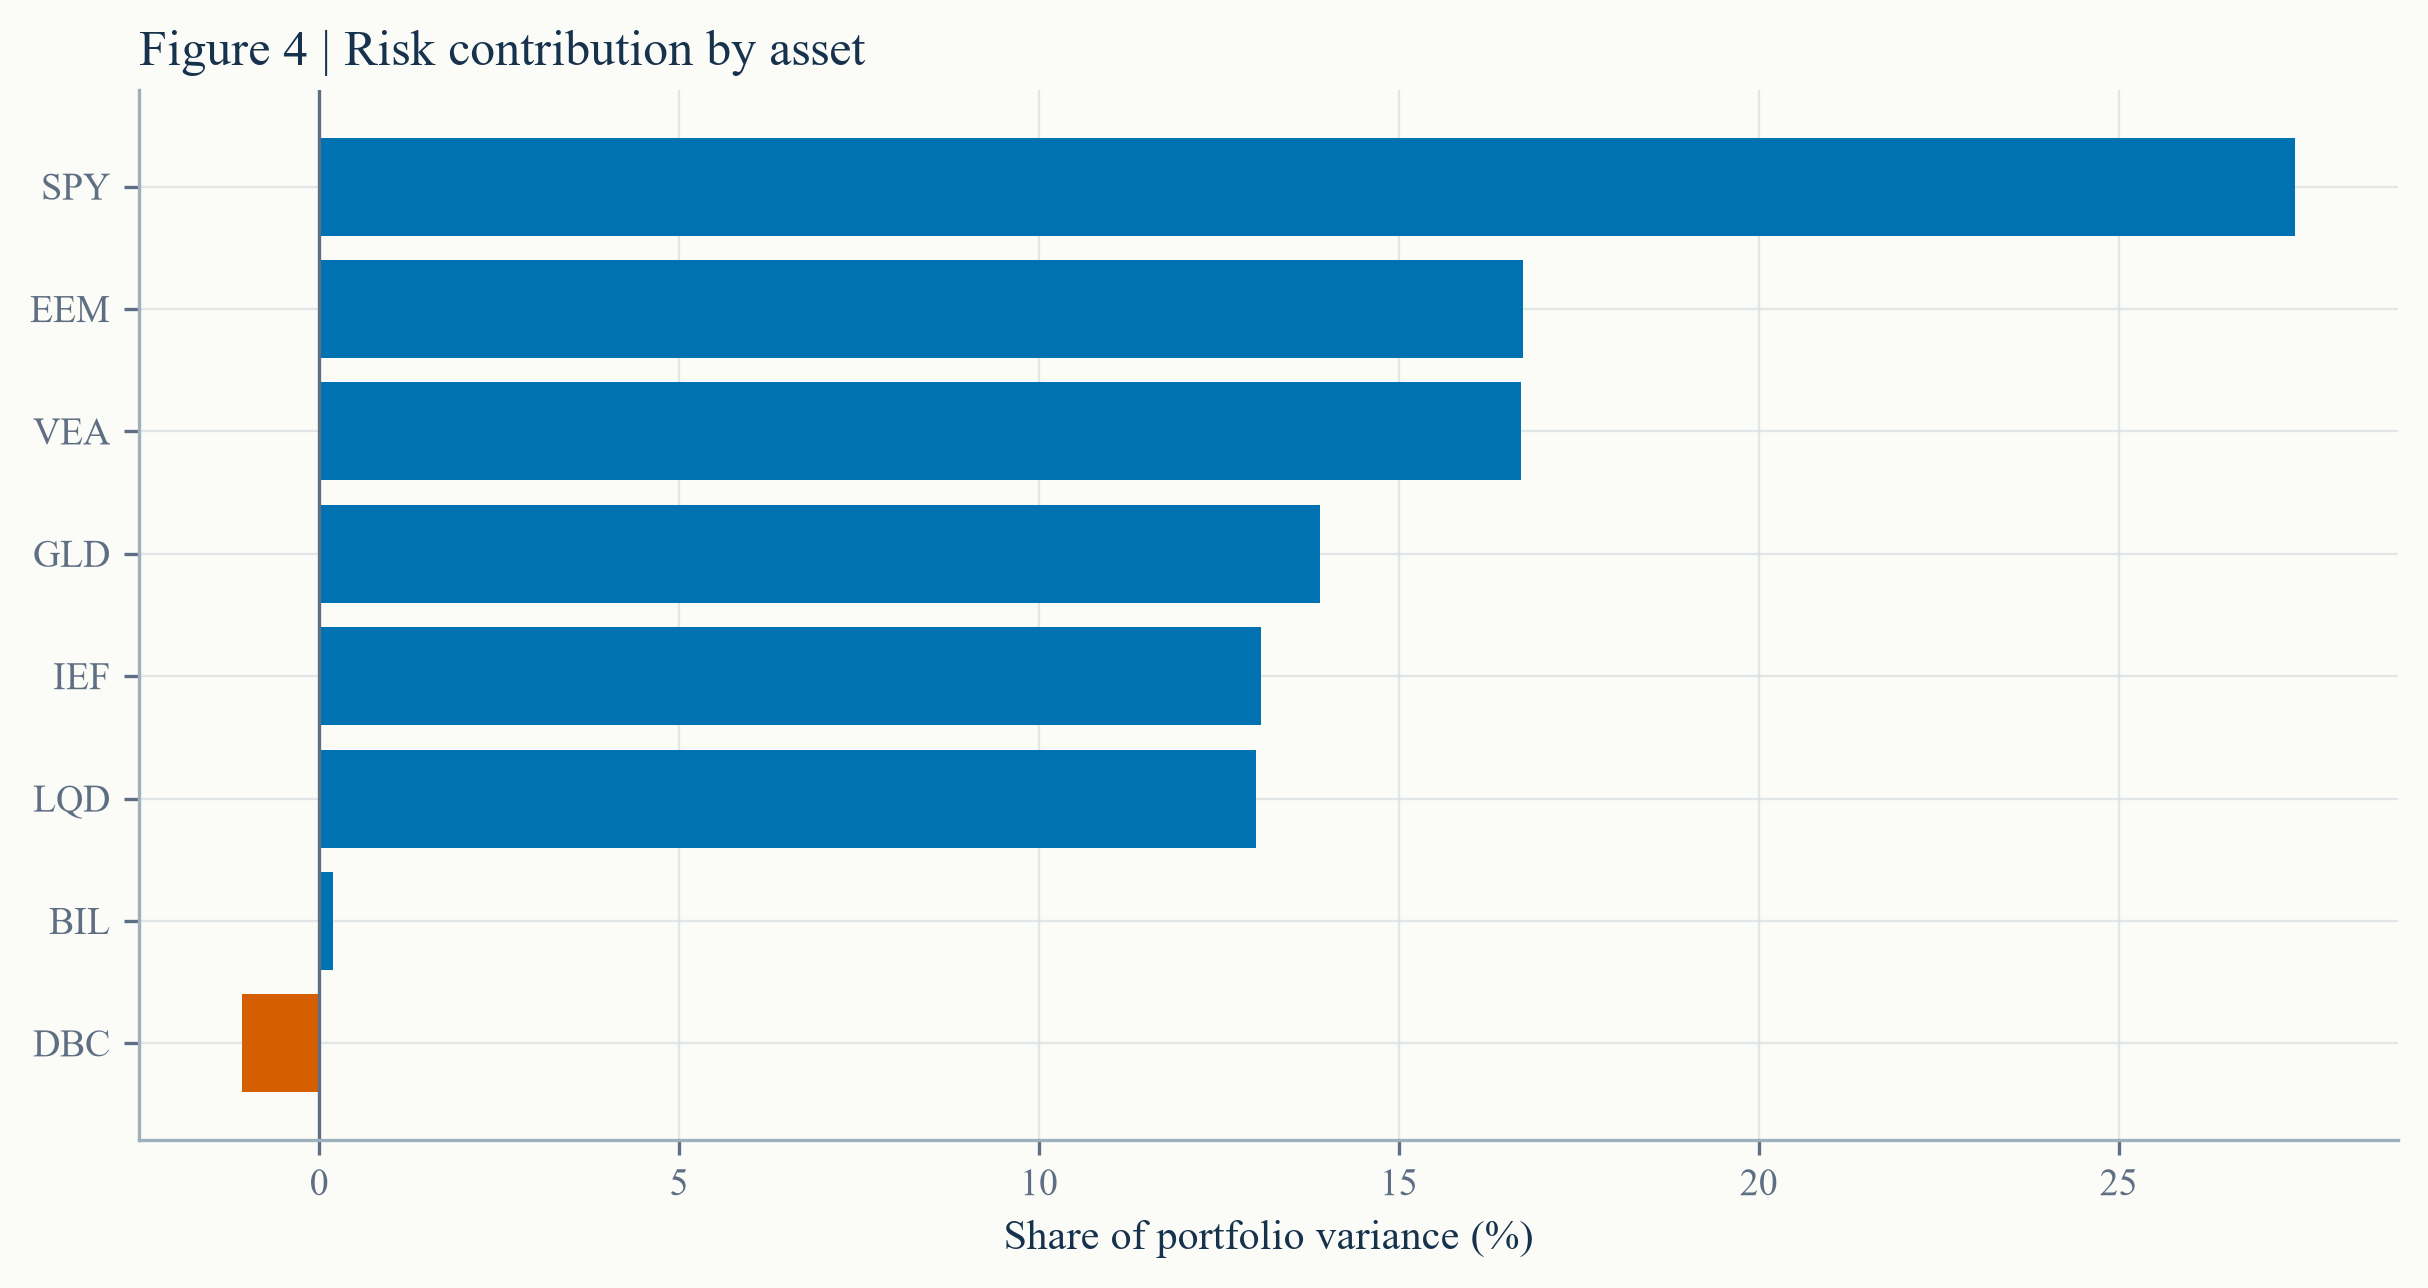
风险归因的作用不是让配置“看起来更稳”,而是回答:如果模型波动率上升,究竟是哪一条资产腿在推动?在这个组合里,答案首先来自权益。The purpose of risk attribution is not to make an allocation look safer. It answers a concrete question: when model volatility rises, which sleeve is driving it? Here the first answer is equity.
来源:L1 项目公开结果;基于最近 36 个月协方差矩阵与当期权重。Source: public L1 results; based on the latest 36-month covariance matrix and current weights.
06收益归因Return attribution
年度收益贡献拆开后,SPY 是最大的单一来源(2.11 个百分点),其次是黄金 0.94、LQD 0.64、IEF 0.59;VEA 与 EEM 分别贡献 0.47 和 0.40。八条腿的算术贡献合计约 5.41 个百分点,与 5.20% 的几何年化接近但不相等;差异来自复利和再平衡路径。Annual return attribution makes SPY the largest single source at 2.11 percentage points, followed by gold at 0.94, LQD at 0.64 and IEF at 0.59; VEA and EEM contribute 0.47 and 0.40. The arithmetic sleeve contributions sum to roughly 5.41%, close to but not equal to the 5.20% geometric CAGR; compounding and the rebalance path explain the gap.
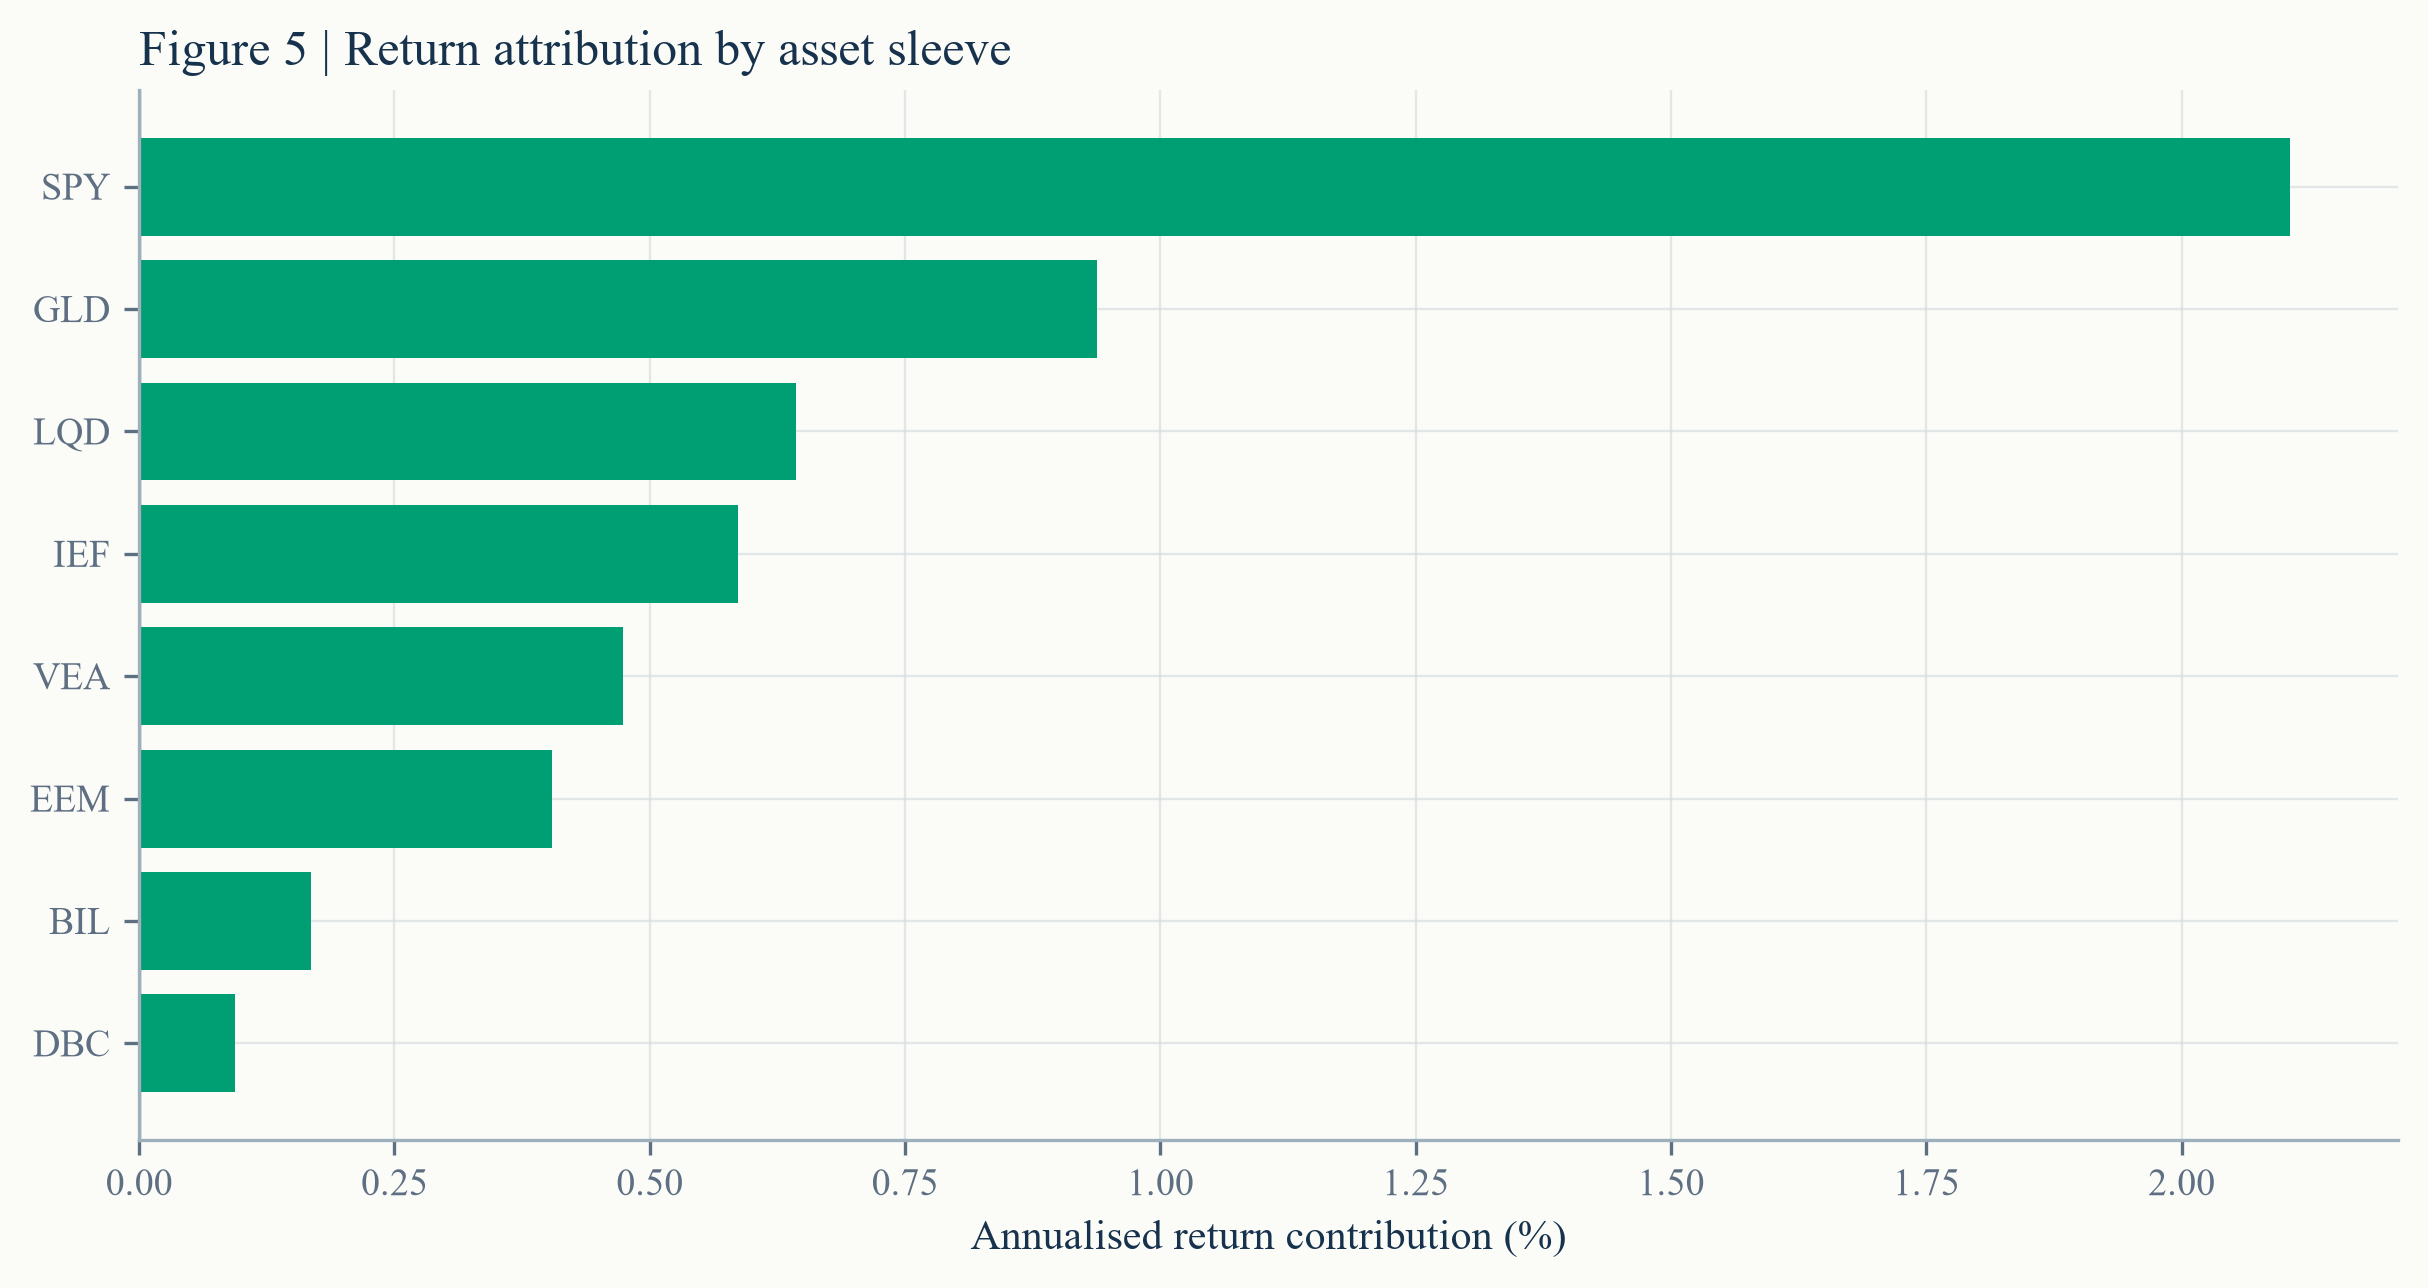
收益归因与风险归因必须一起读:黄金的风险贡献高,收益贡献也高;权益的风险贡献最高,但收益贡献集中在 SPY;商品在当前快照中提供分散效应,却没有成为主要收益来源。Return and risk attribution must be read together: gold has both high risk and high return contribution; equity carries the most risk but its return is concentrated in SPY; commodities diversify the current snapshot without becoming a major return source.
来源:L1 项目公开结果;按 L1 TAA 月度资产贡献平均后年化。Source: public L1 results; monthly L1 TAA sleeve contributions, averaged and annualised.
| 资产腿Sleeve | 政策Policy | 当期Current | 风险贡献Risk | 收益贡献Return |
|---|---|---|---|---|
| SPY · US large-cap equity | 20.00% | 20.11% | 27.46% | 2.11% |
| VEA · Developed ex-US equity | 10.00% | 9.95% | 16.70% | 0.47% |
| EEM · Emerging-market equity | 10.00% | 9.36% | 16.72% | 0.40% |
| IEF · US 7-10 year Treasury | 20.00% | 20.43% | 13.09% | 0.59% |
| LQD · US investment-grade credit | 15.00% | 15.31% | 13.02% | 0.64% |
| GLD · Gold | 10.00% | 9.64% | 13.90% | 0.94% |
| DBC · Broad commodities | 5.00% | 5.20% | -1.07% | 0.09% |
| BIL · US 1-3 month Treasury bills | 10.00% | 10.00% | 0.19% | 0.17% |
07决策流程Decision process
这个 L1 项目对转型买方最有价值的部分,不是结果本身,而是它把“什么时候允许改变决策”写清楚了。固定规则可以减少事后解释;版本化管理则允许策略演化,但不允许悄悄重写历史。The most transferable part of L1 is not the result. It is the explicit answer to “when is the decision allowed to change?” Fixed rules reduce post-hoc explanation; versioning permits evolution without silently rewriting history.
对买方研究岗位,这四点比一个漂亮的回测曲线更接近真实工作:组合经理会追问结论何时失效、数据何时可见、成本如何计入、策略变了以后旧业绩怎么处理。L1 把这些问题的答案变成了代码、配置和月度记录。For a buy-side research role, these four controls are closer to real work than a pretty backtest. A portfolio manager will ask when the conclusion breaks, what information was visible, how costs entered and what happens to old performance after a rule change. L1 turns those answers into code, configuration and a monthly record.
08局限与结论Limits and conclusion
这不是实盘,也没有真实 PnL。所有结果来自公开 ETF 数据的纸面组合。它不证明个人具备管理真实资金的能力,也不构成投资建议。This is not a live portfolio and contains no real PnL. All results come from a paper portfolio using public ETF data. They do not prove capability to manage real money and are not investment advice.
其他限制包括:资产池只有美国上市 ETF;HKD 换算未对冲;未建模市场冲击、税费和券商执行;60/40 只是简化代理;样本期只有一段宏观环境;趋势规则只有有限参数和一次政策冻结。未来的更新必须增加滚动样本、替代资产池、成本敏感性和完整的版本记录。Other limits include a US-listed ETF universe, unhedged HKD translation, no market-impact, tax or broker-execution model, a simplified 60/40 proxy, one macro sample and a trend rule with limited parameter variation and a single policy freeze. Future updates need rolling samples, alternative universes, cost sensitivity and a complete version history.
结论不是“这个策略值得投”。结论是:这套流程足以让一个观点被检验、被否决,并继续产生可比较的月度记录。对早期转型者,诚实报告负结果本身就是可验证的研究能力。The conclusion is not “this strategy deserves capital.” It is that the process can test a view, reject it and keep producing comparable monthly evidence. For an early-career transition, reporting a negative result honestly is itself a verifiable research skill.
延伸阅读Further reading
- Markowitz, H. (1952). Portfolio Selection. The Journal of Finance, 7(1), 77–91. doi.org/10.1111/j.1540-6261.1952.tb01525.x
- Ibbotson, R. G., & Kaplan, P. D. (2000). Does Asset Allocation Policy Explain 40, 90, or 100 Percent of Performance? Financial Analysts Journal, 56(1), 26–33. doi.org/10.2469/faj.v56.n1.2327
- Moskowitz, T. J., Ooi, Y. H., & Pedersen, L. H. (2012). Time Series Momentum. Journal of Financial Economics, 104(2), 228–250. doi.org/10.1016/j.jfineco.2011.11.003
- Arnott, R. D., Harvey, C. R., & Markowitz, H. (2019). A Backtesting Protocol in the Era of Machine Learning. Journal of Financial Data Science, 1(1), 64–74. doi.org/10.3905/jfds.2019.1.064
- 数据与代码:L1 公开项目,github.com/Aayloo/l1-multi-asset-shadow,访问日期 2026-10-30。Data and code: public L1 project, github.com/Aayloo/l1-multi-asset-shadow, accessed 30 October 2026.